


A recent paper examines a variety of ancient sites including stone circles, tumuli and kofuns associated with Japanese rulers, castles, temples, and other structures. Analysis of site alignments provides insight into the evolution of astronomical knowledge in Japan, and the role of Shinto, geomancy, and other influences in the design and layout of these sites. This article discusses two of Japan’s most enigmatic megalithic structures.
Introduction
Japanese history begins with the long prehistory of the Jomon Period (c. 14,000–300 BCE), when hunter-gatherer communities created some of the world’s earliest pottery and developed complex ritual and village life long before agriculture became widespread. The succeeding Yayoi period (c. 300 BCE–300 CE) saw the introduction of wet-rice farming, metal tools, and social stratification—changes largely driven by interactions with the Korean Peninsula and China. By the Kofun period (c. 250–538 CE), powerful clans built massive keyhole-shaped tombs for their leaders and laid the foundations of a unified Yamato state. The Asuka and Nara periods (6th–8th centuries) brought Buddhism, Chinese-style law codes, and Japan’s first centralized imperial institutions. Over time, political power shifted to the warrior class, leading to centuries of samurai rule under various shogunates. Although later eras – medieval, early modern, and modern – transformed Japan in dramatic ways, the deep cultural roots of the Jomon, Yayoi, Kofun, and early imperial periods remain fundamental to understanding Japan’s historical identity.
Osaka Castle
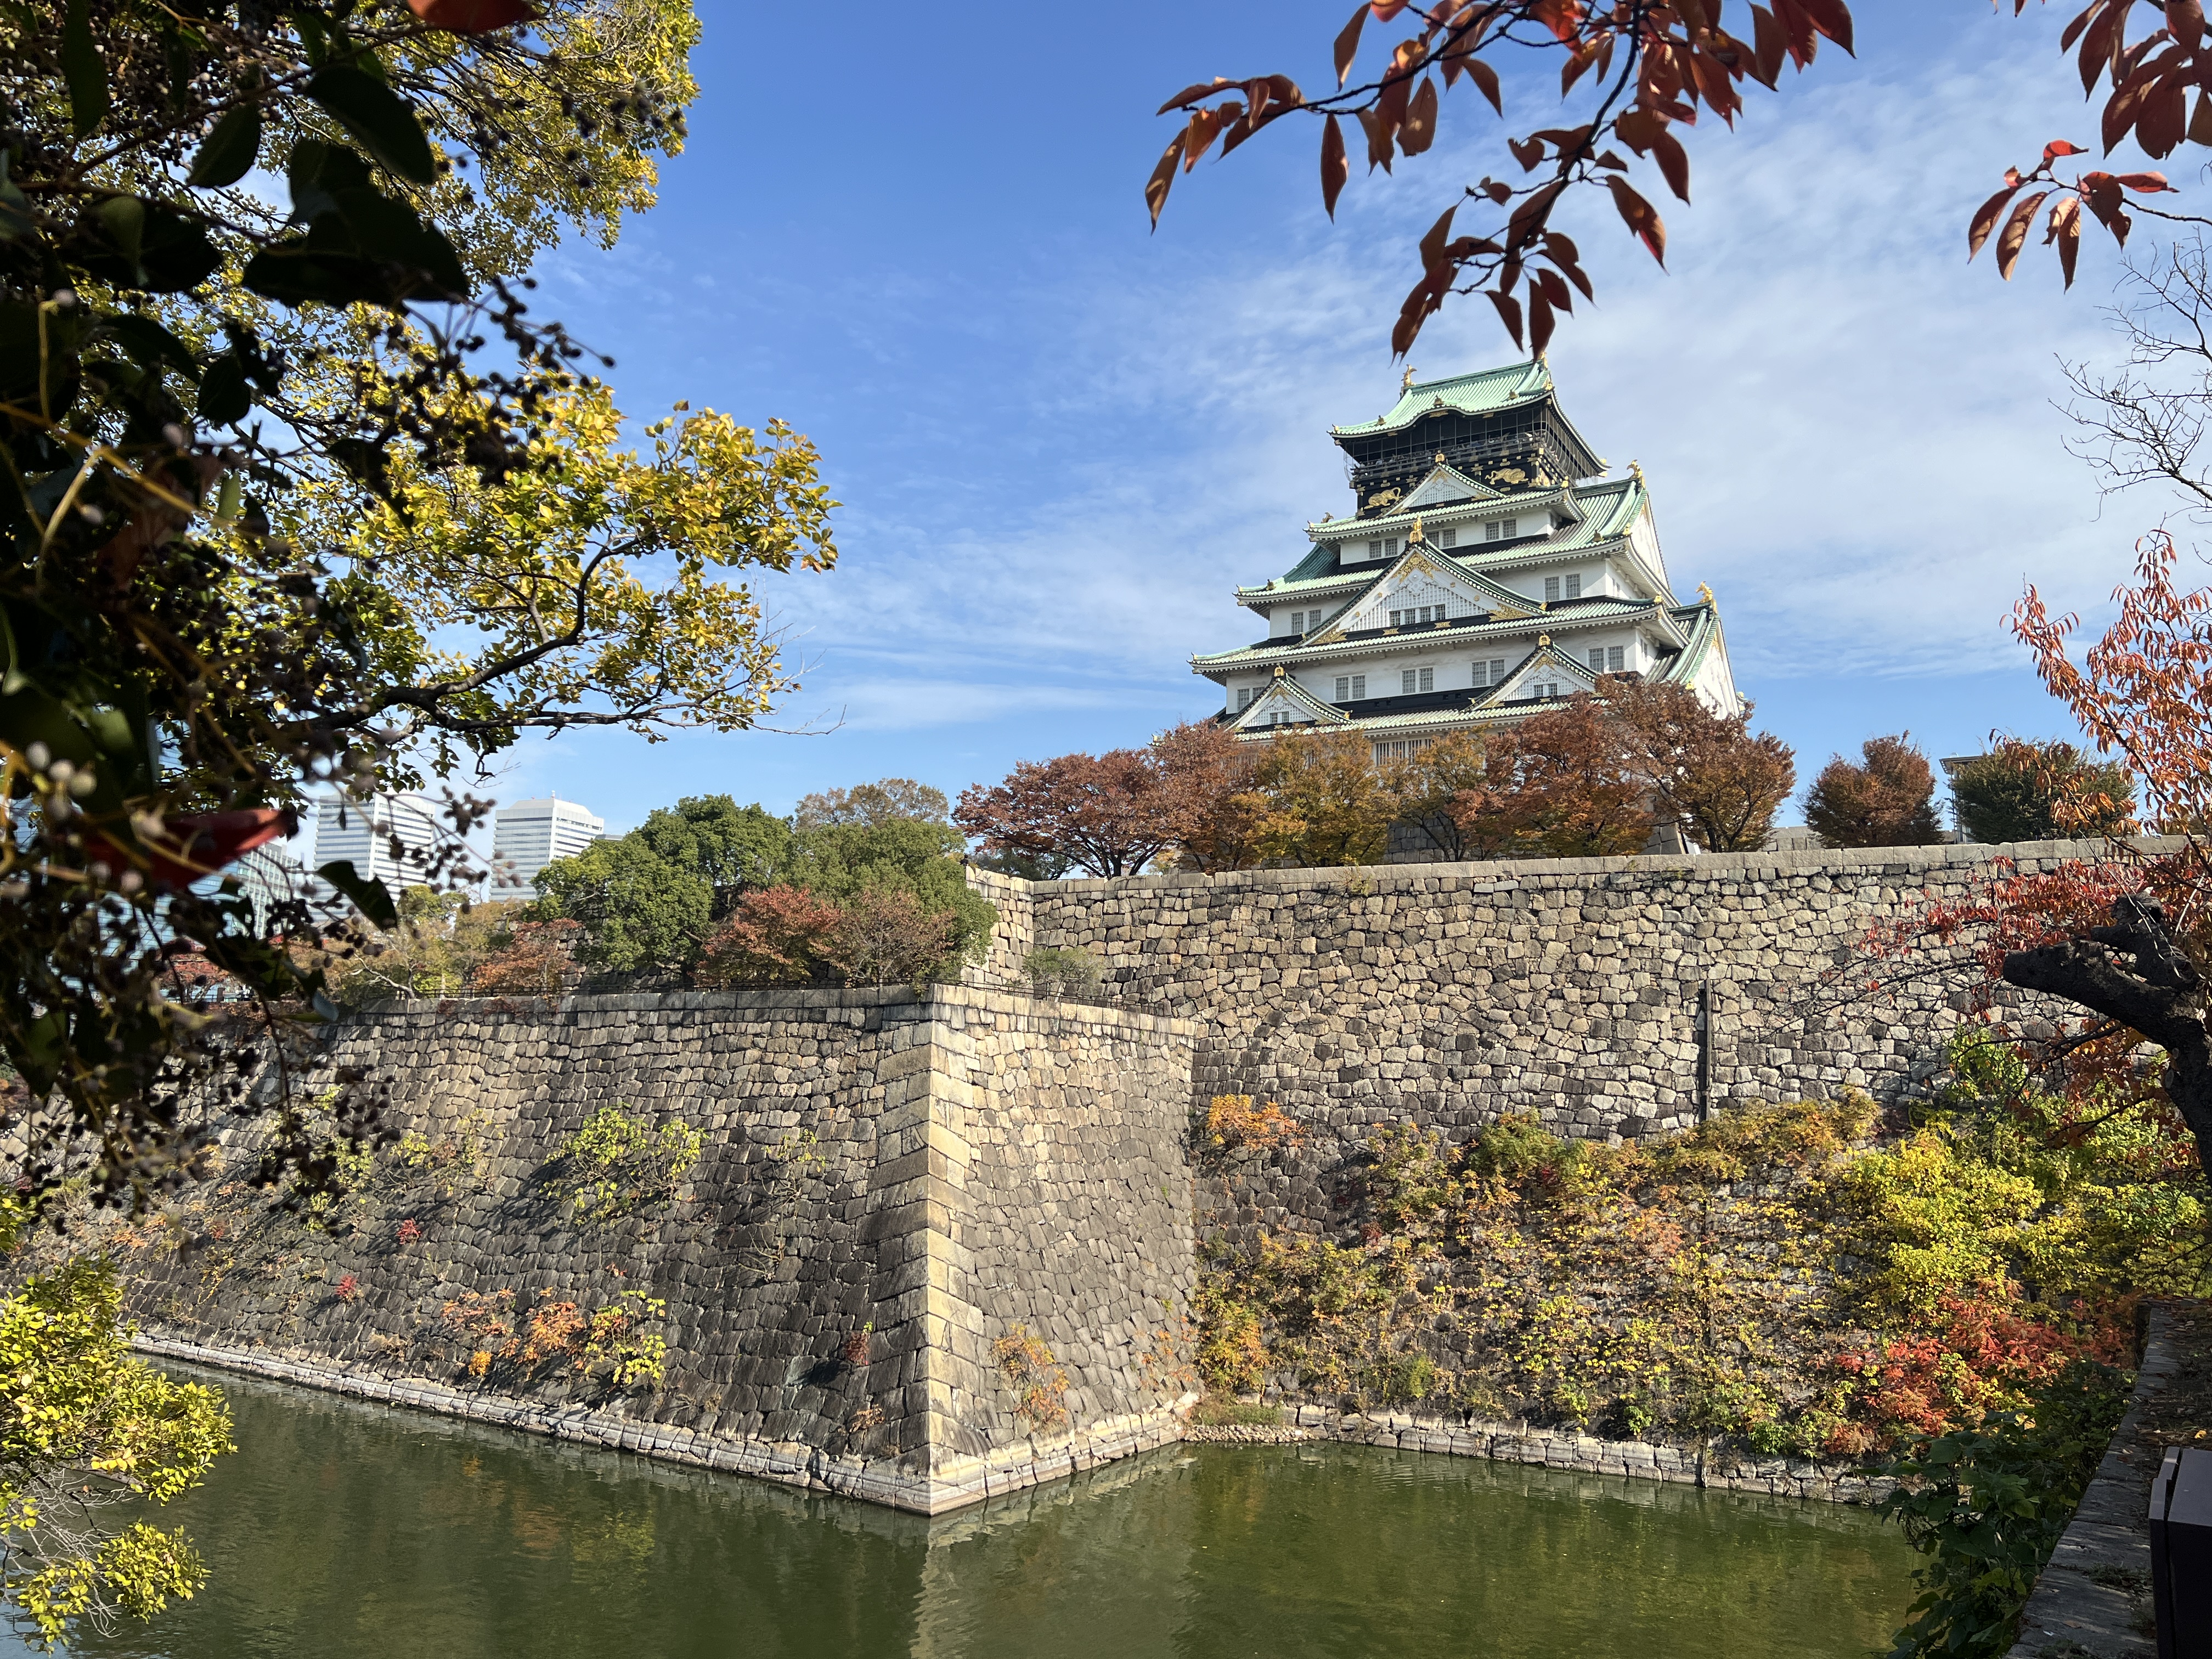
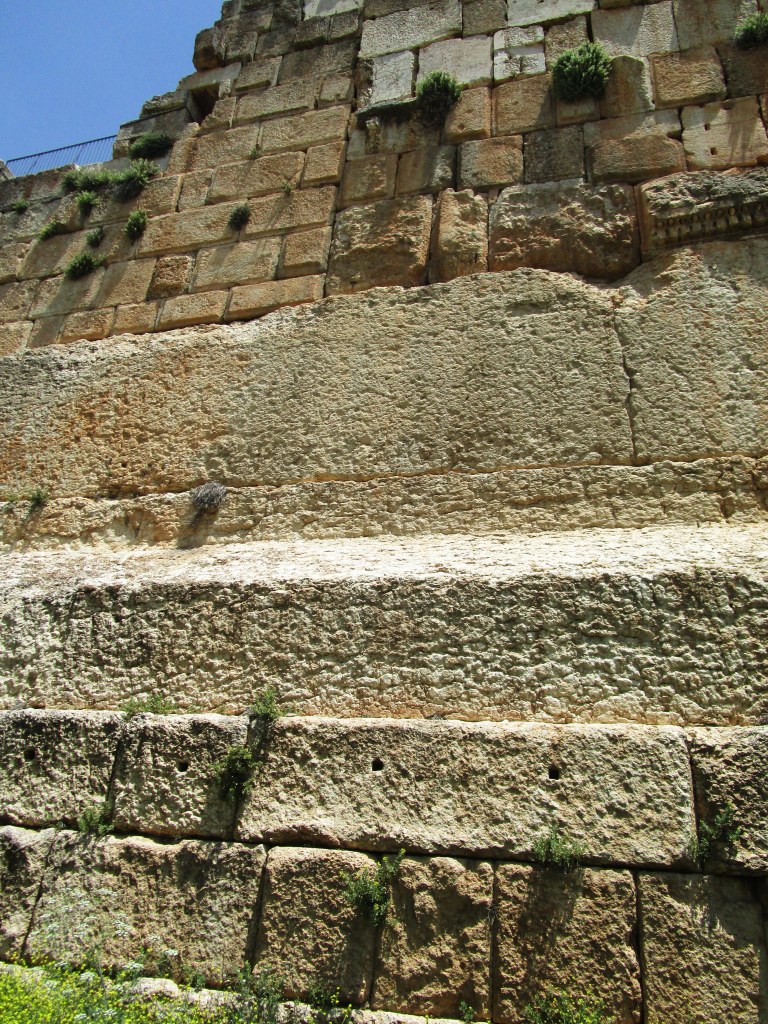
We begin at Osaka Castle where Japan’s third-largest megalith is a part of one of the castle’s inner walls. Osaka Castle was built during the Shogunate Period when Japan was ruled by a hereditary military commander called a shogun. Numerous castles were established during this period. A practice known as feng shui, which was introduced to Japan from China around the 7th century, played a role in how shoguns and regional lords selected, oriented, and structured castles, castle towns, and even entire capitals. While not every decision was based on geomancy, feng shui principles were widely understood and frequently invoked from the medieval era onward.
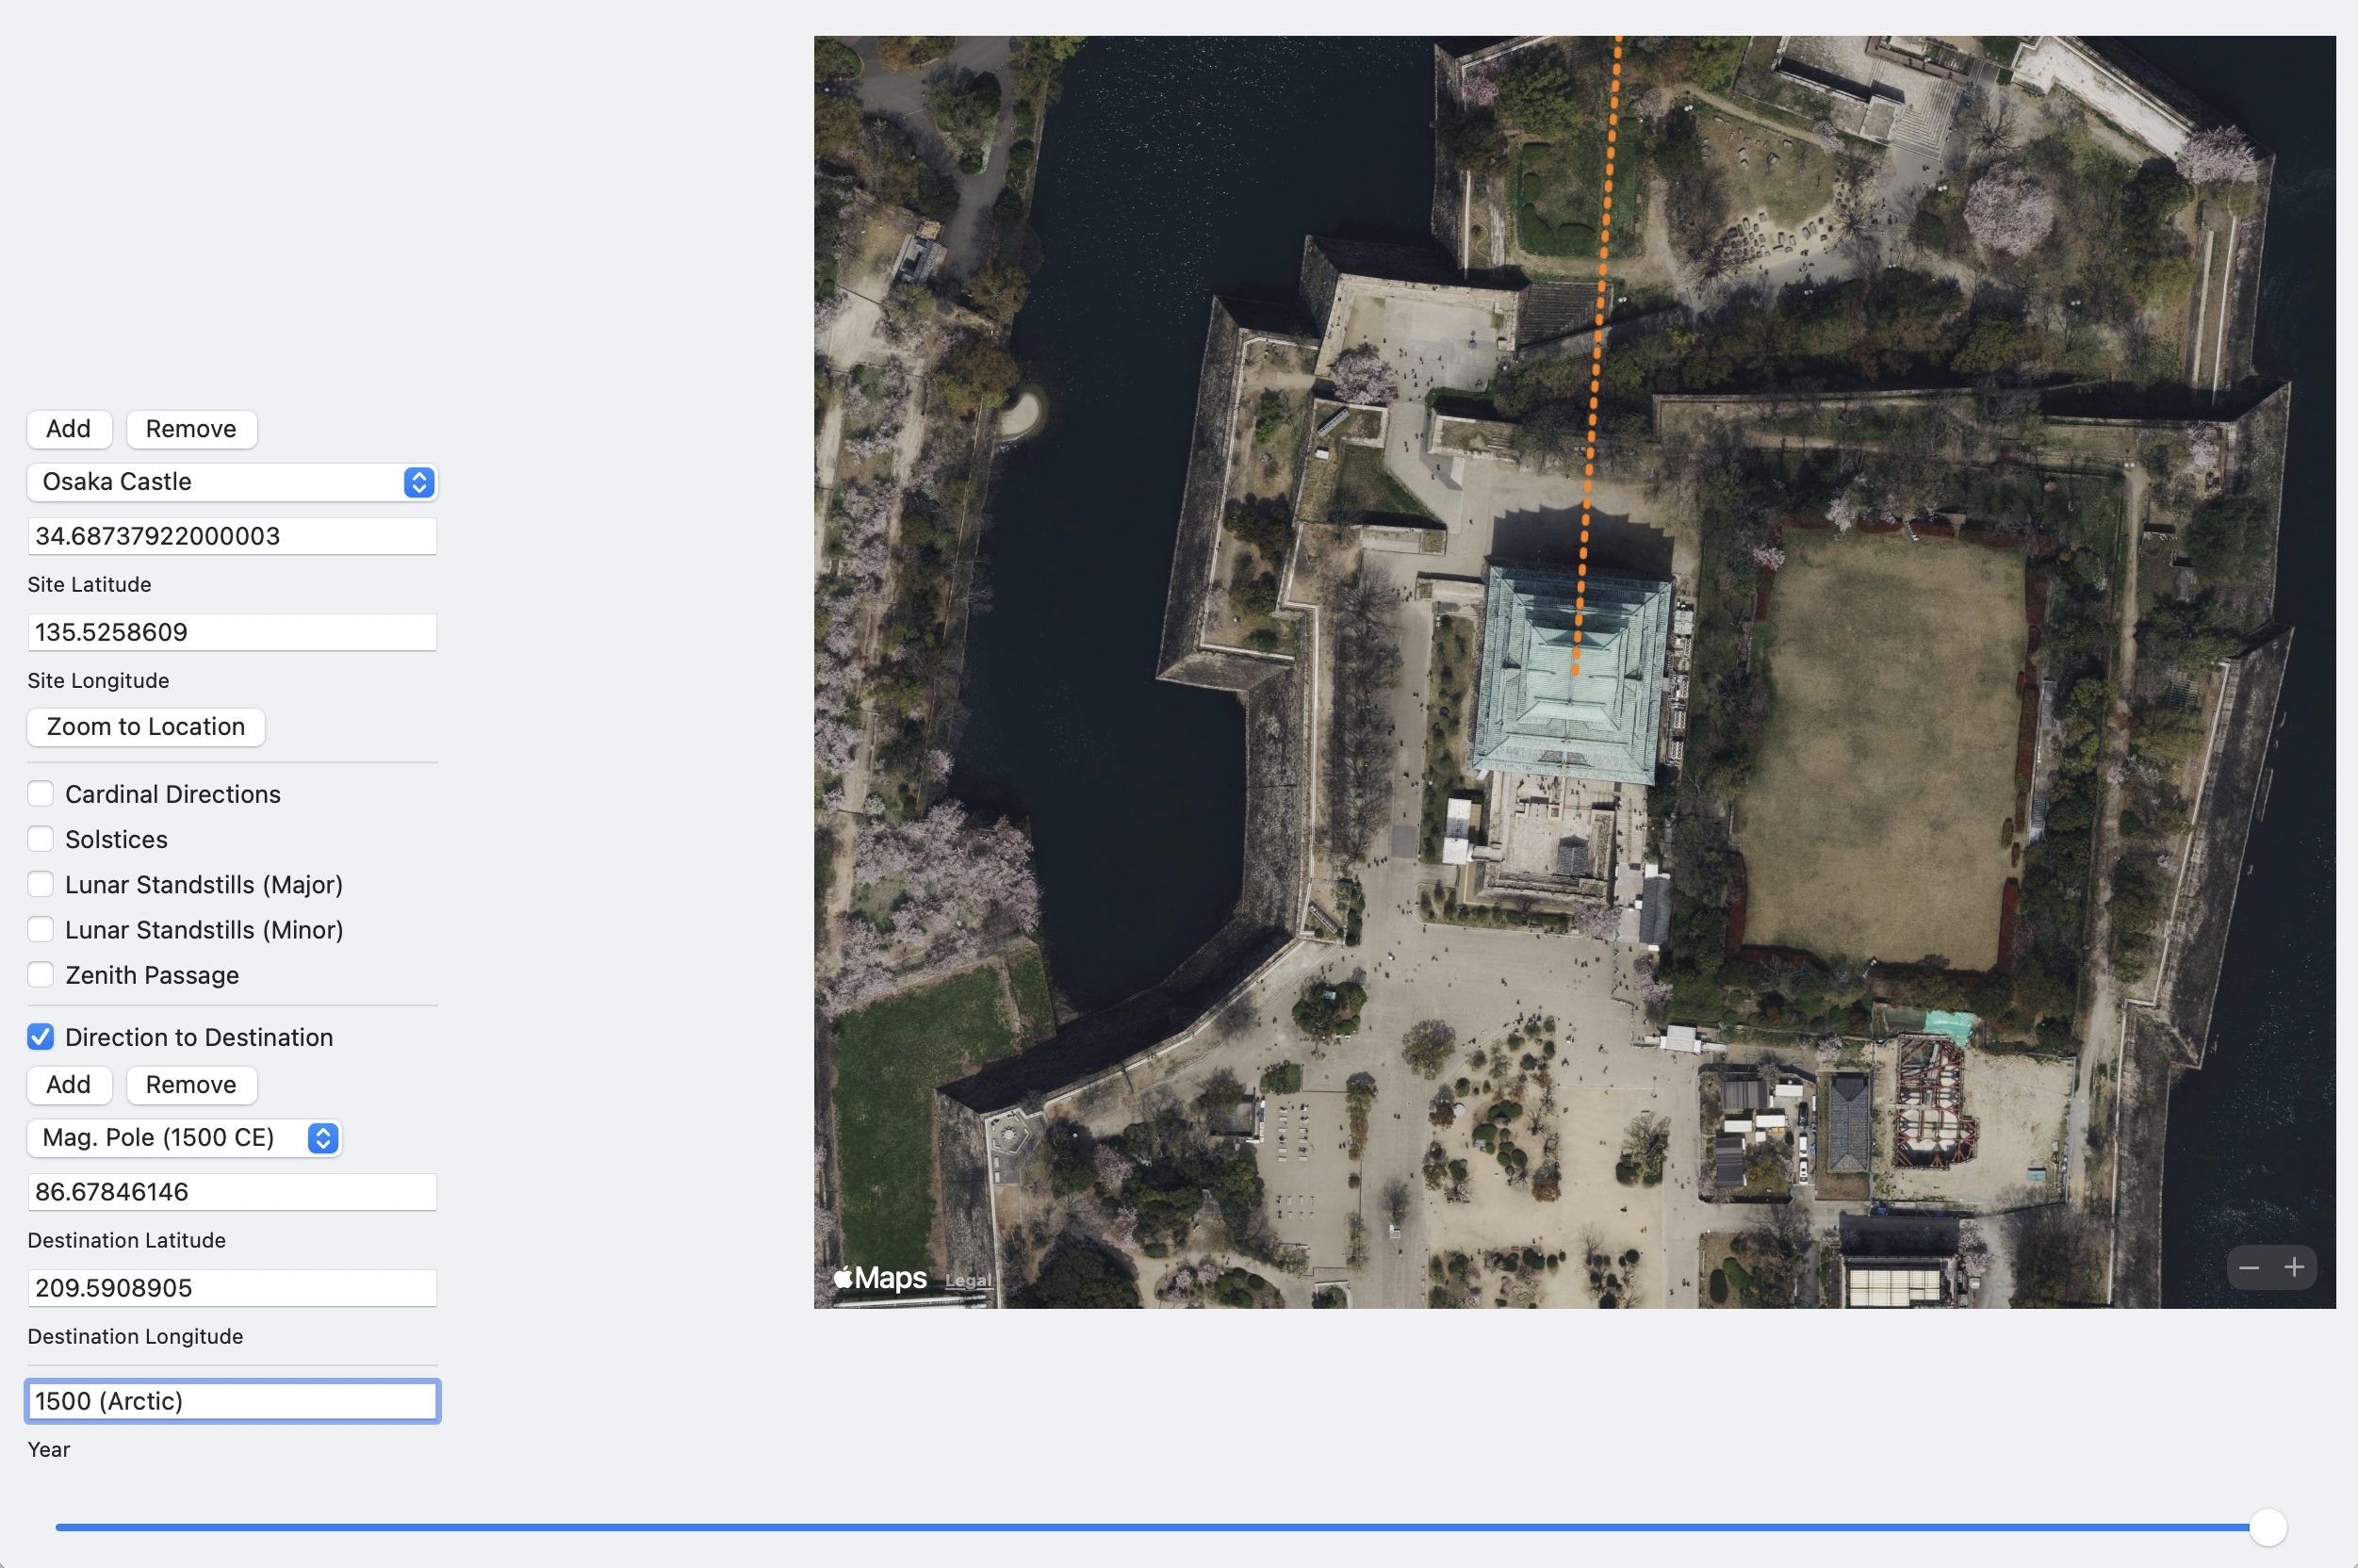
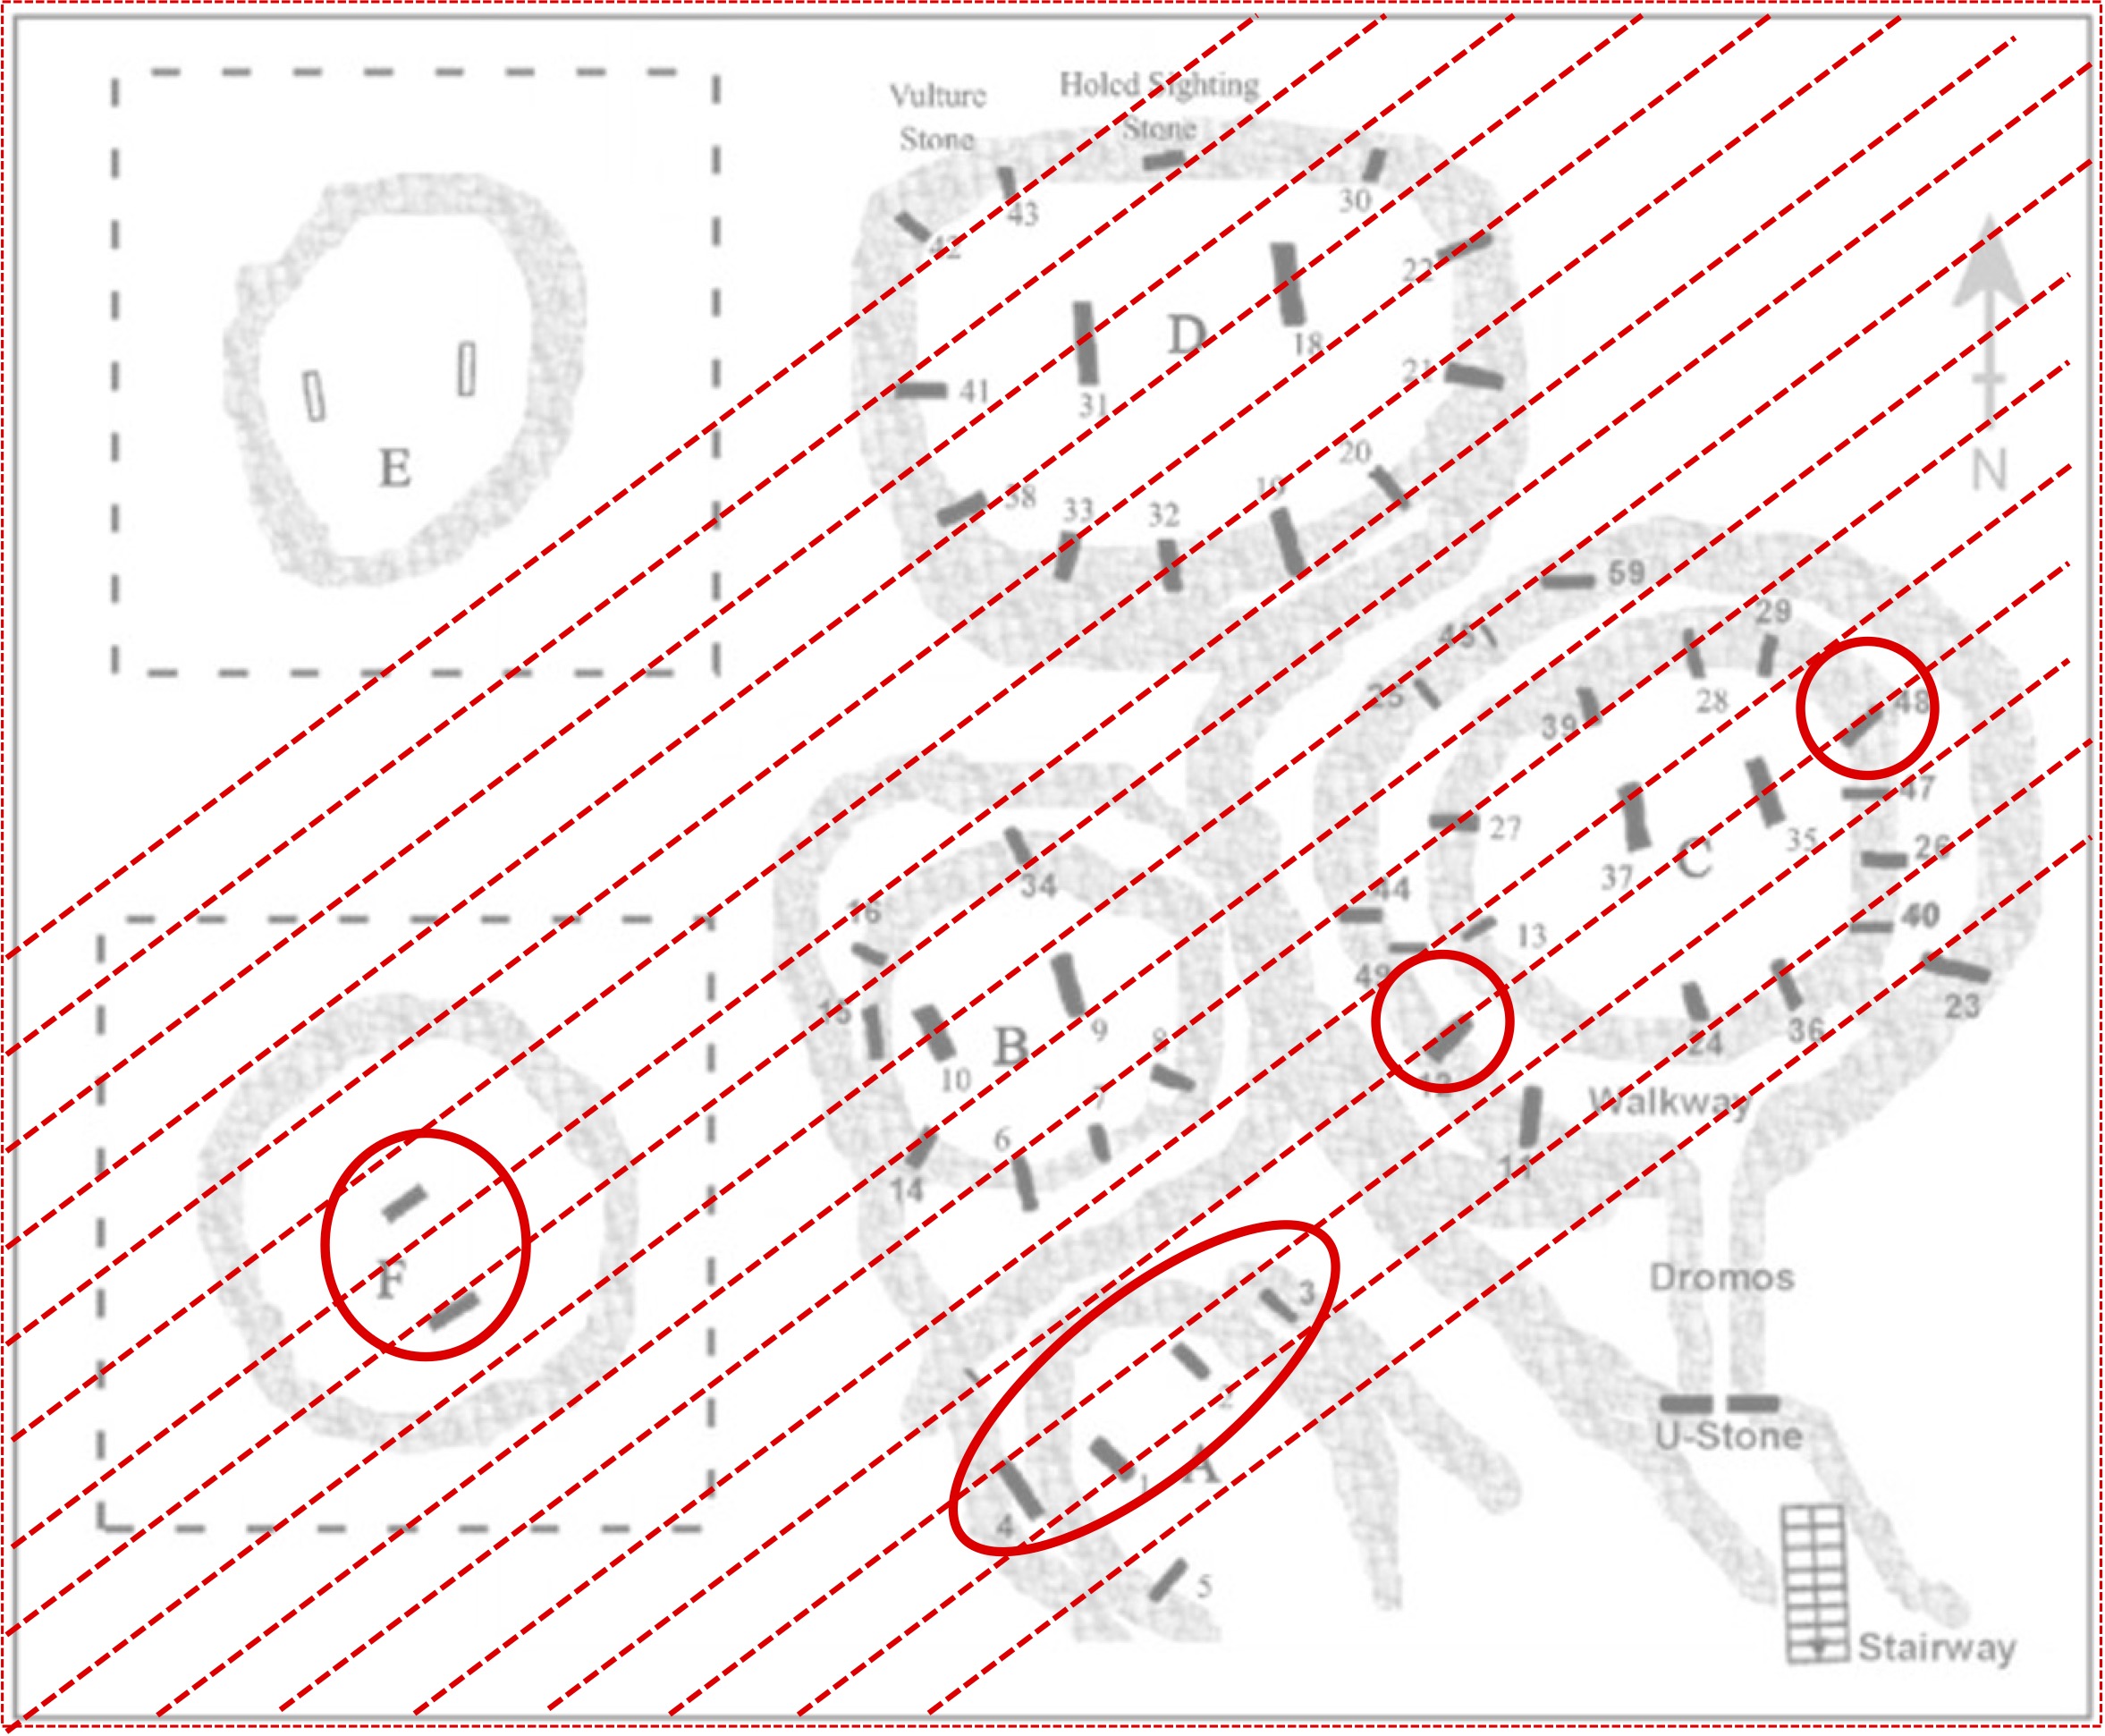
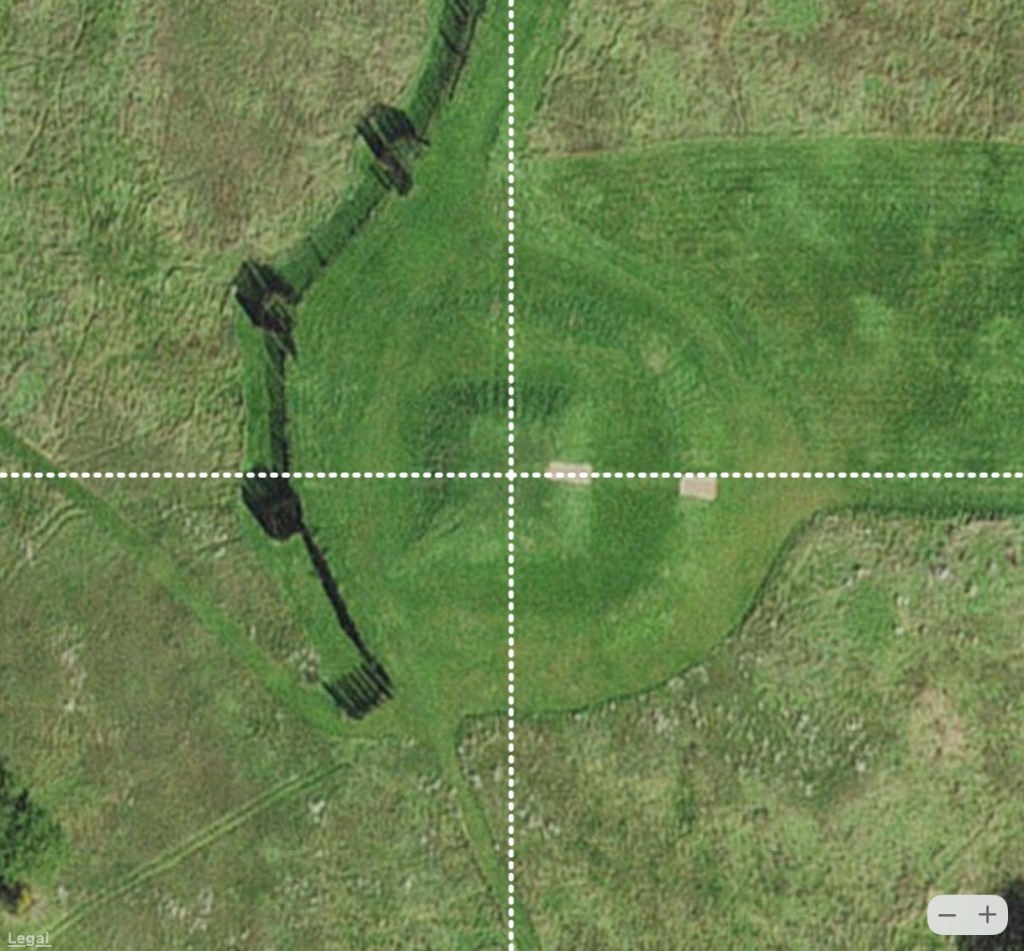
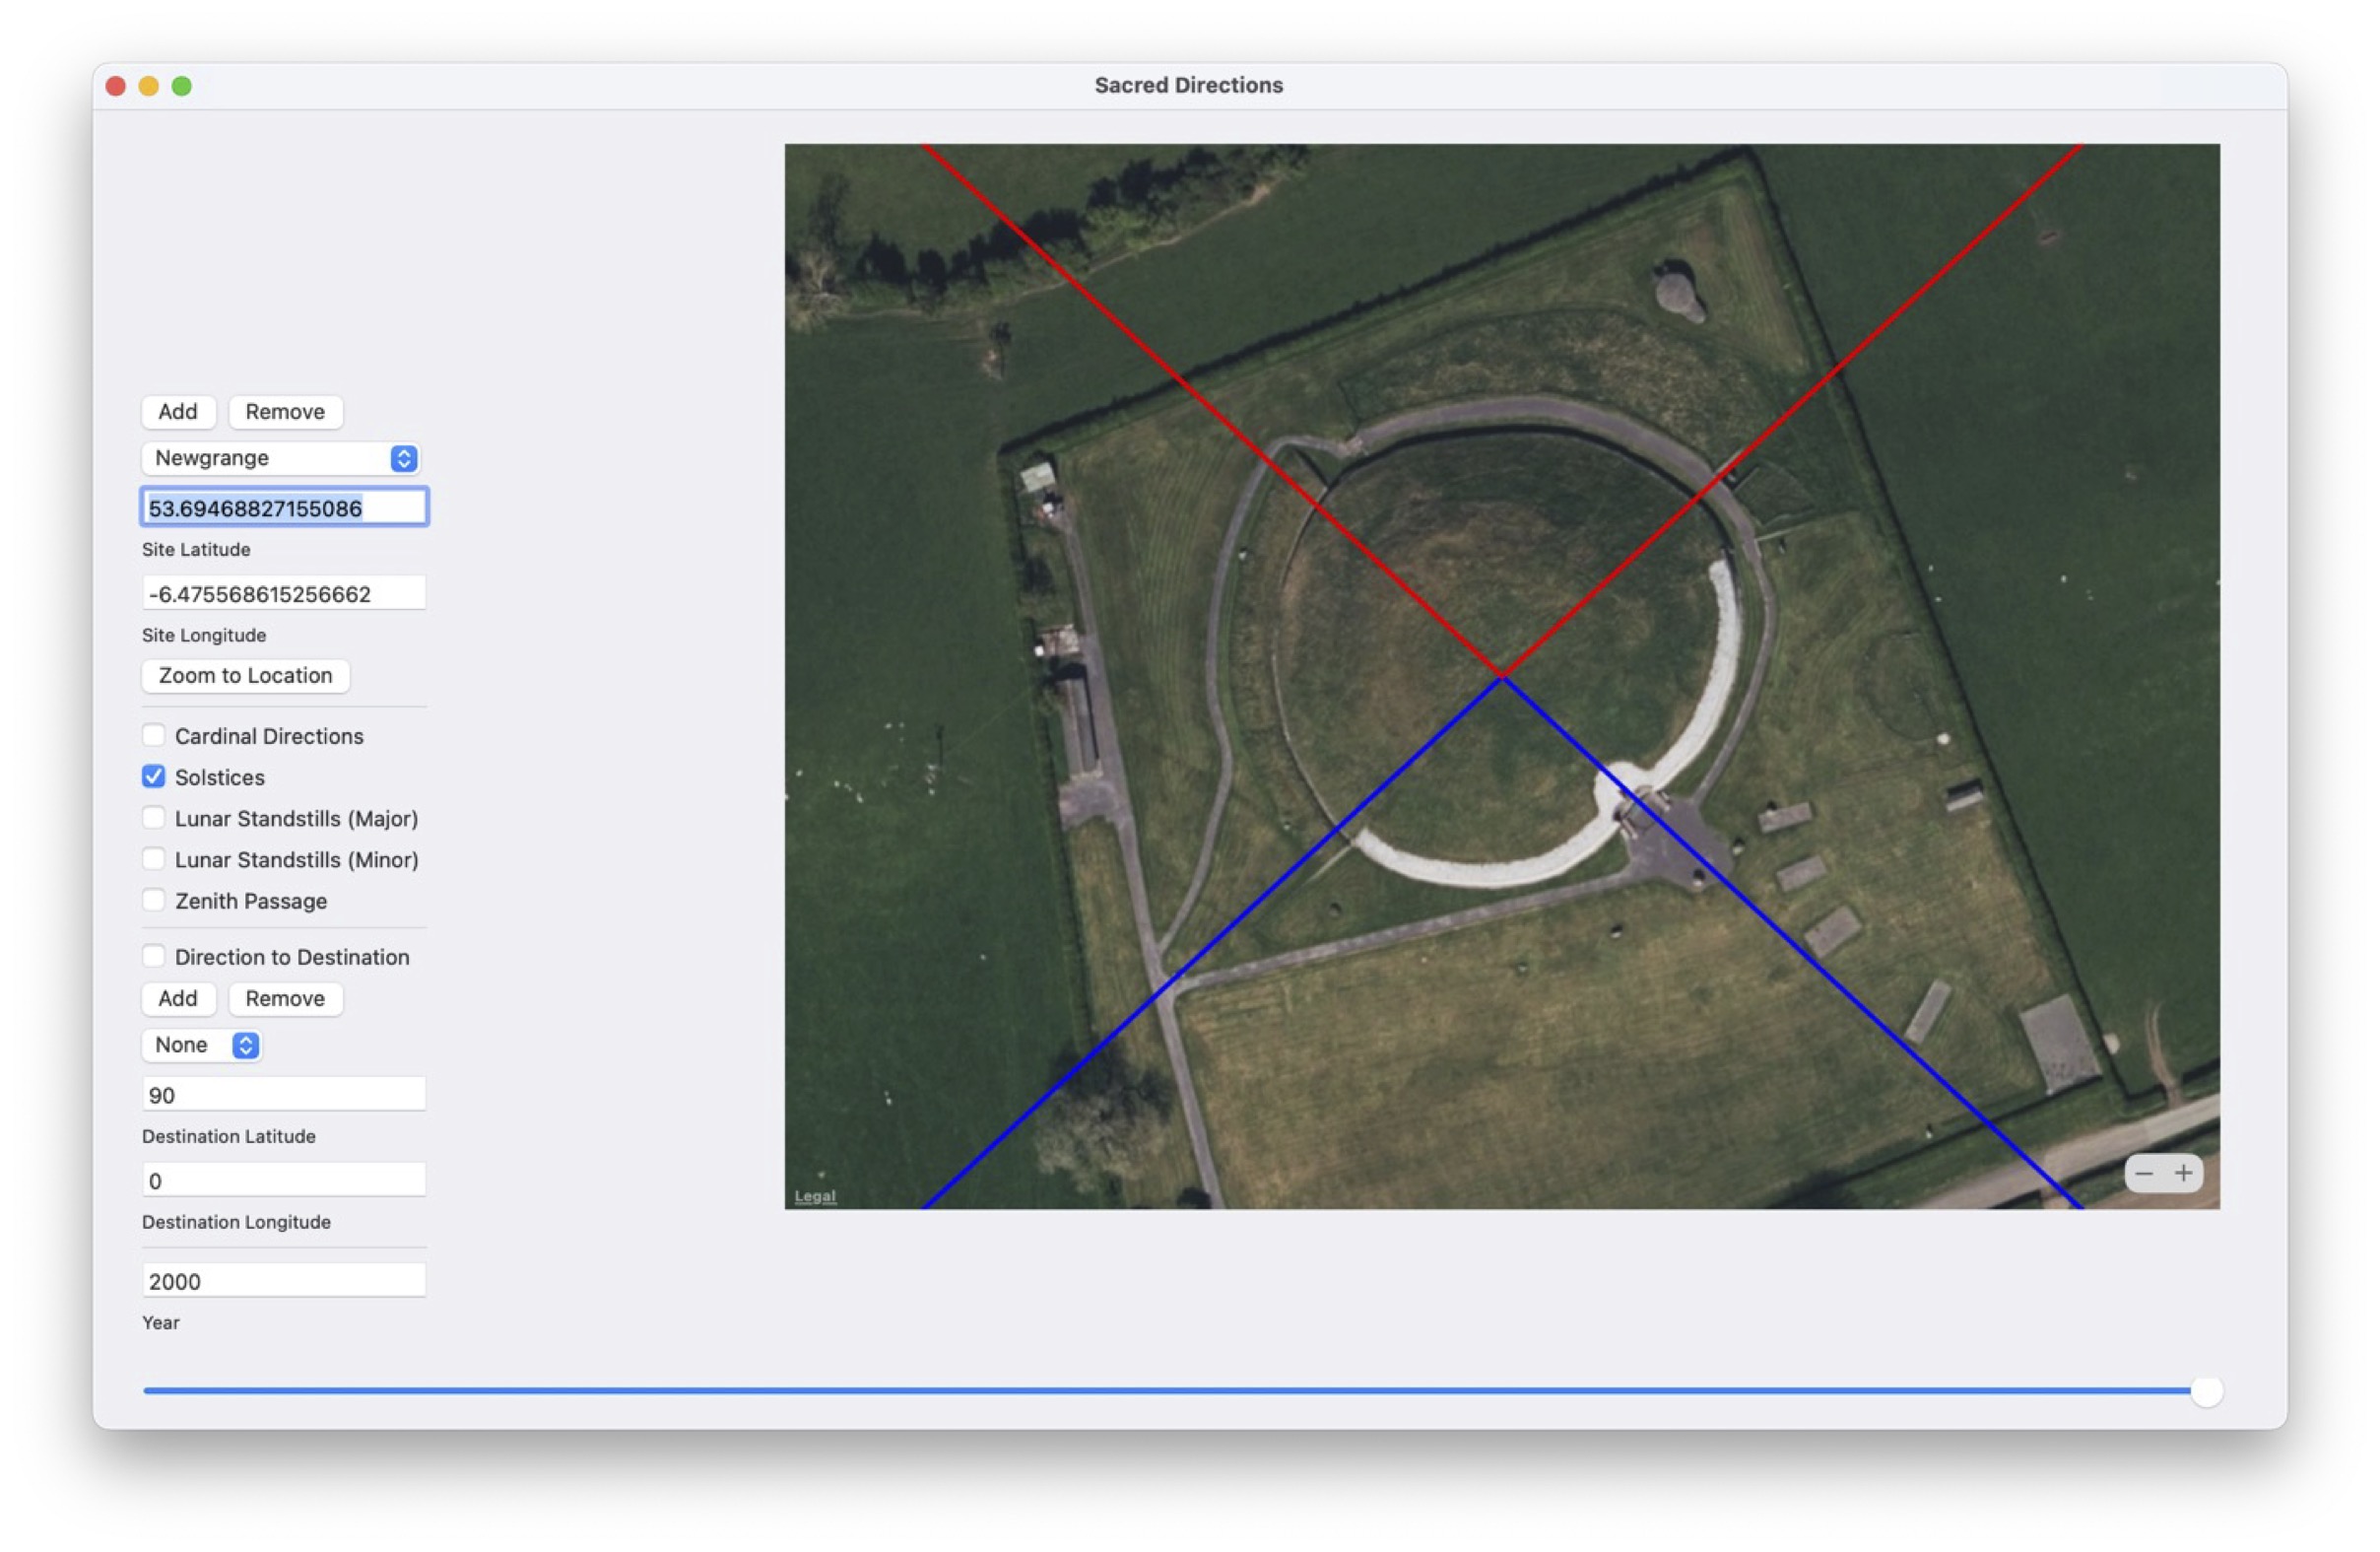
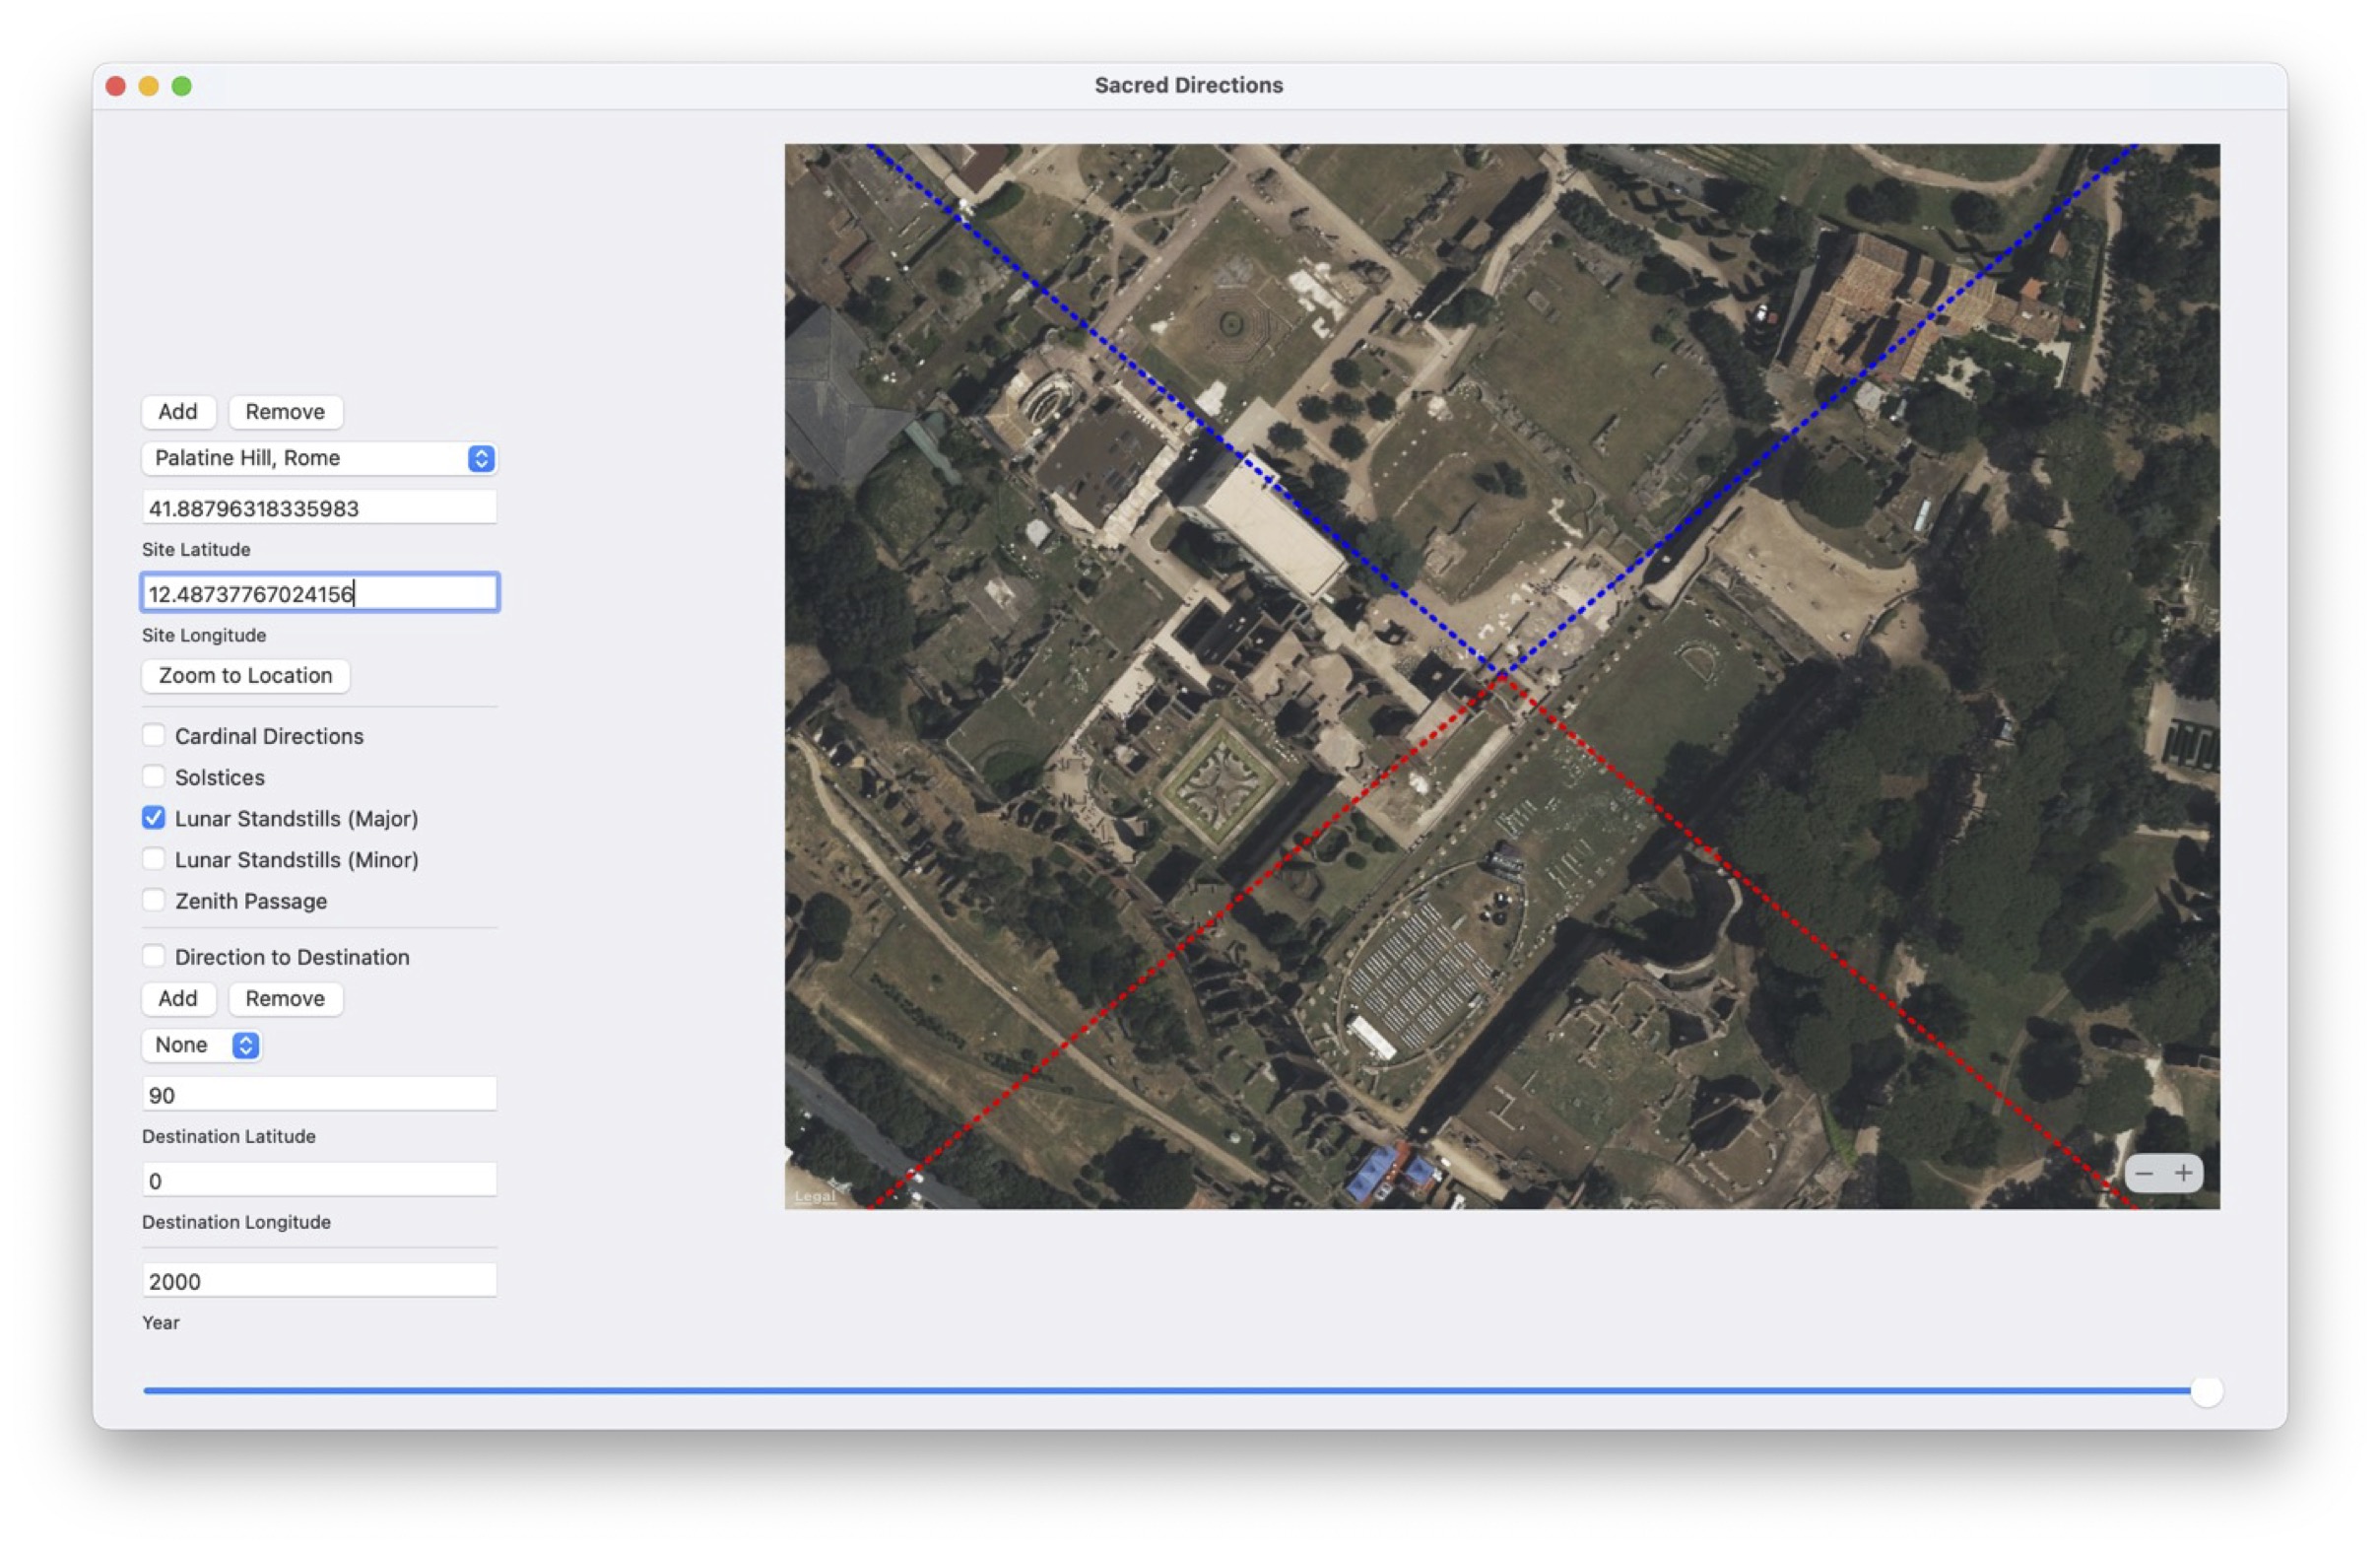
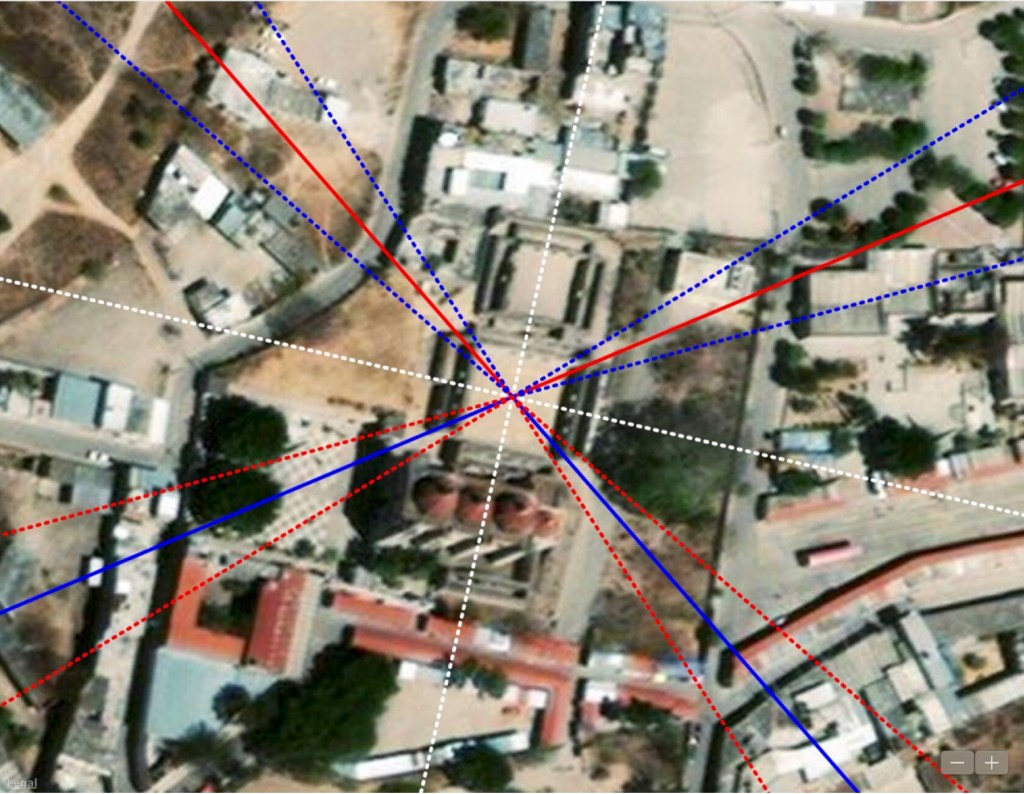
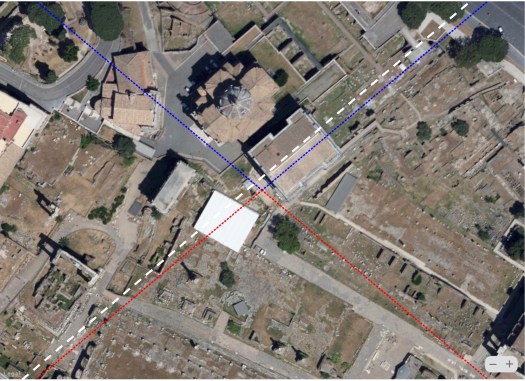
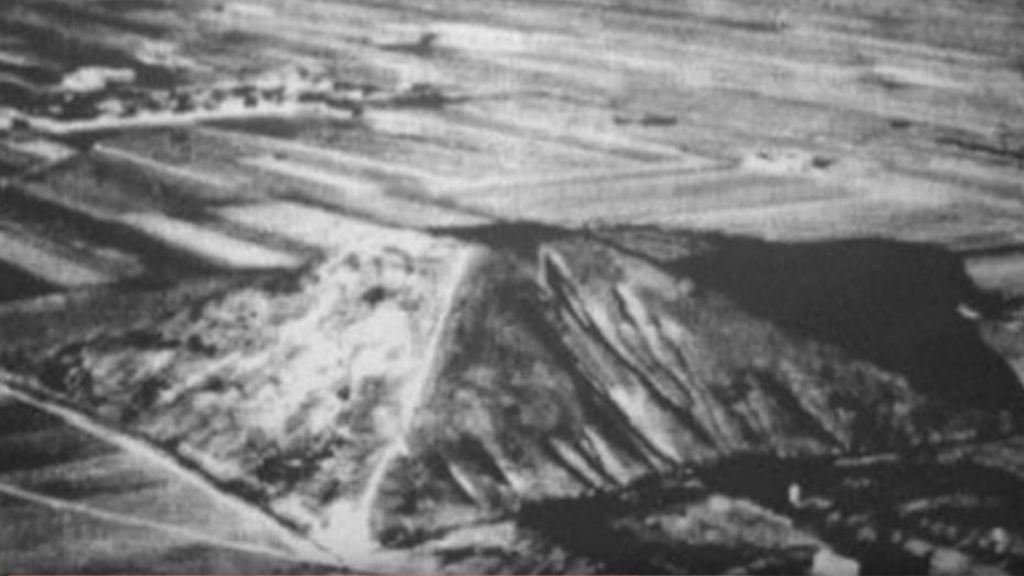
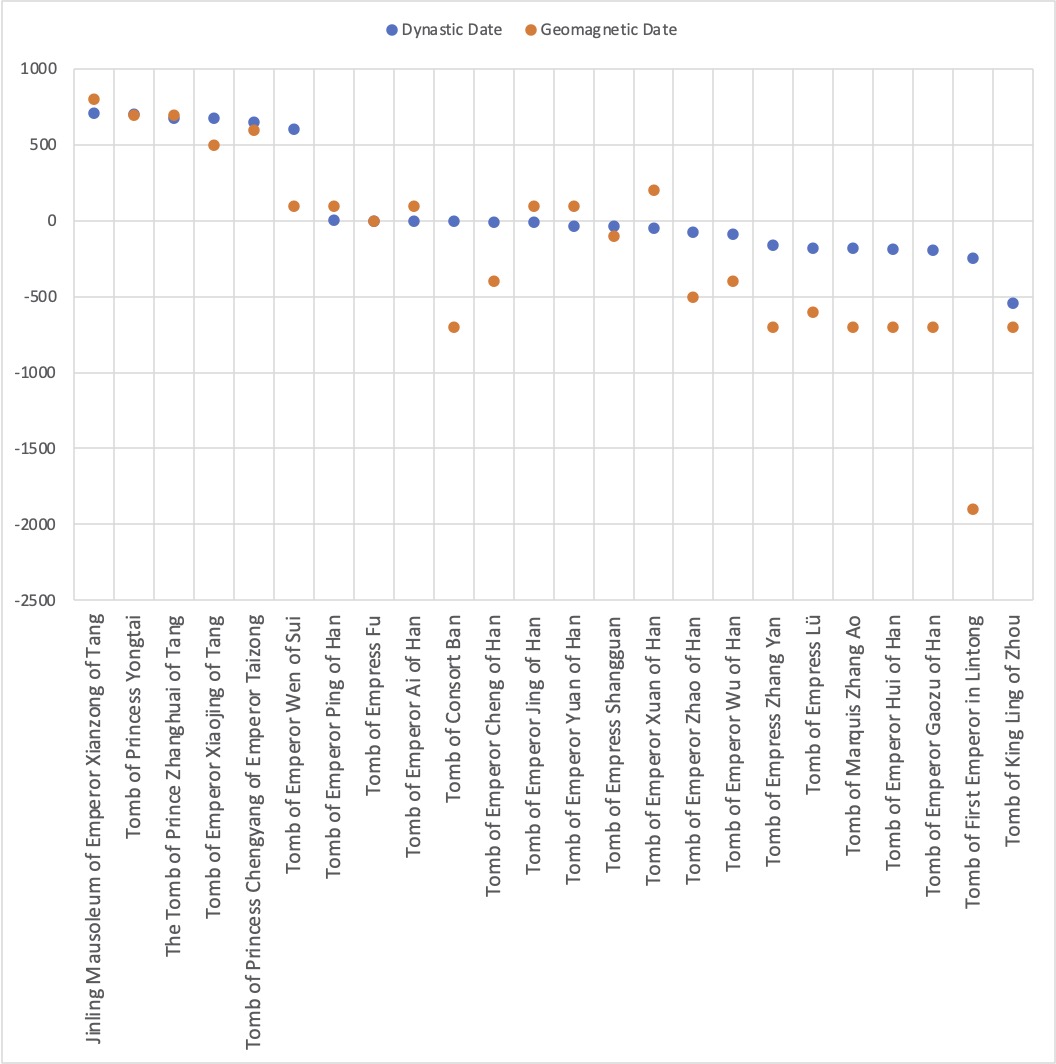
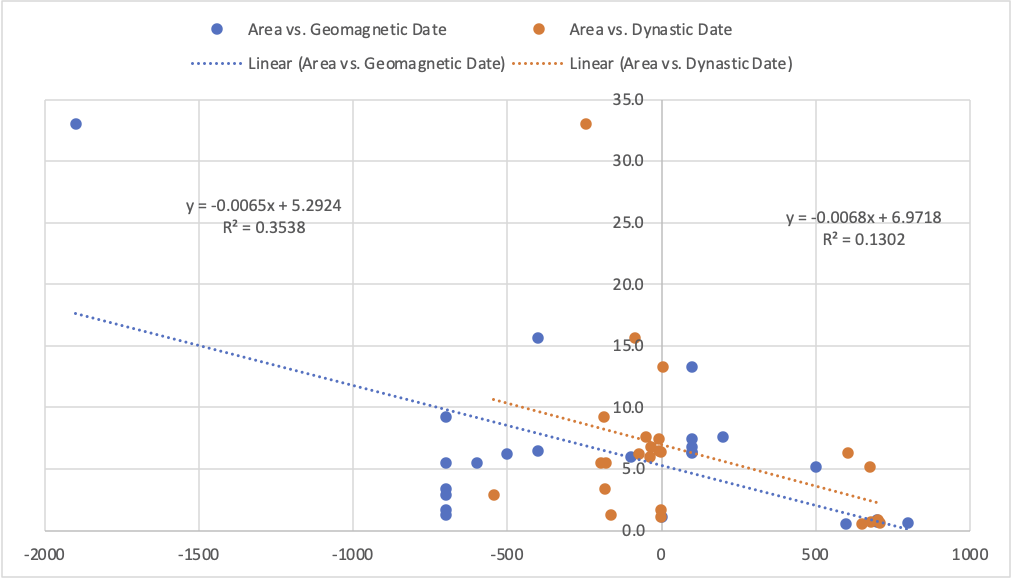
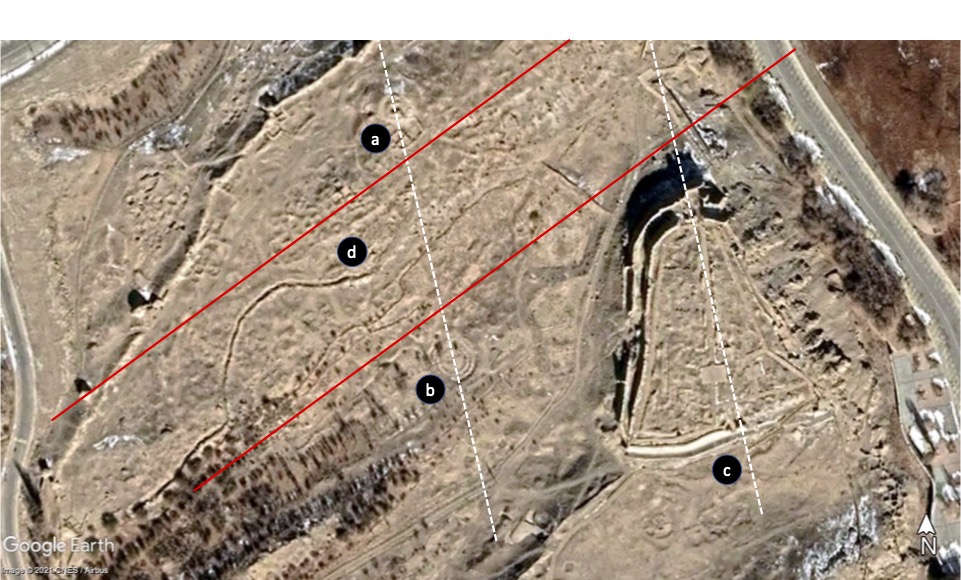
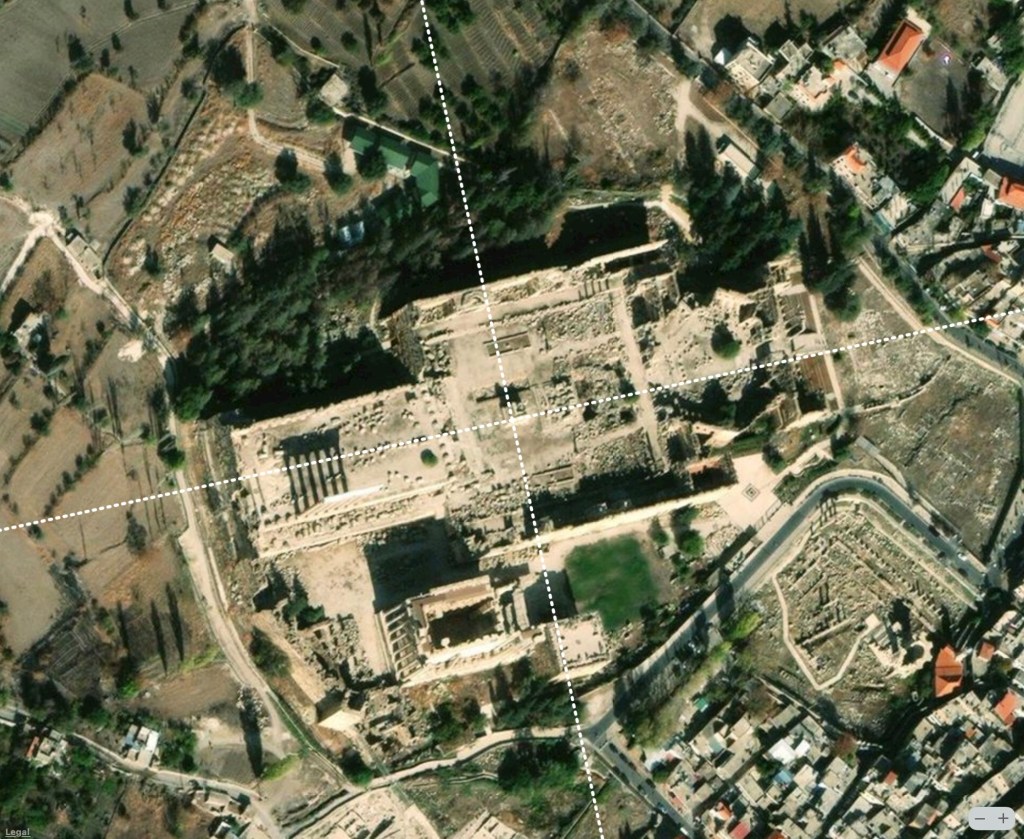
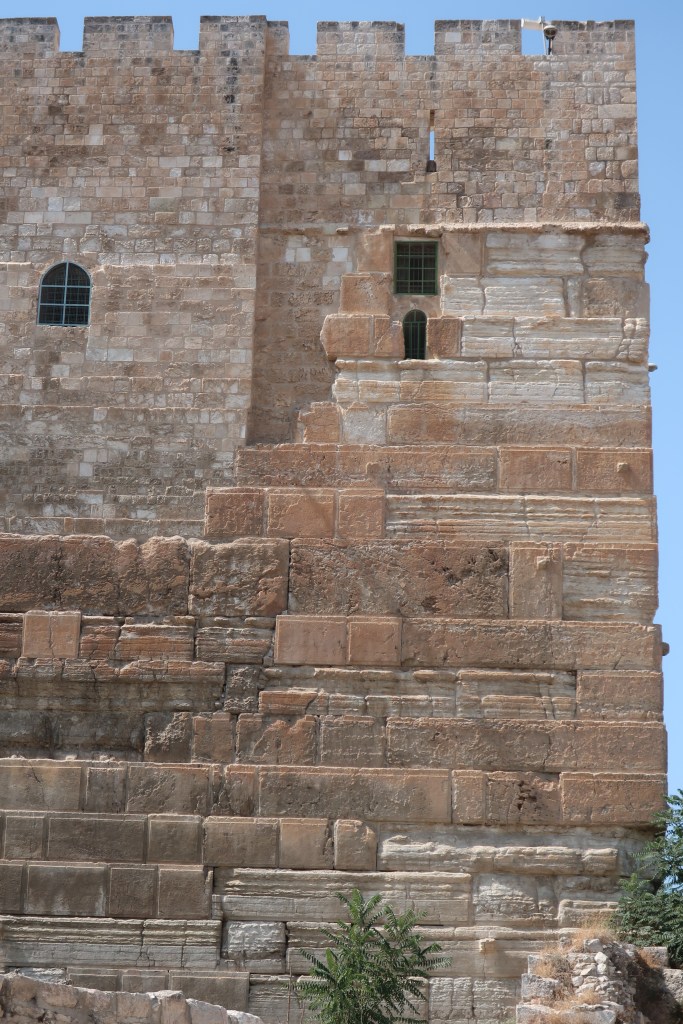
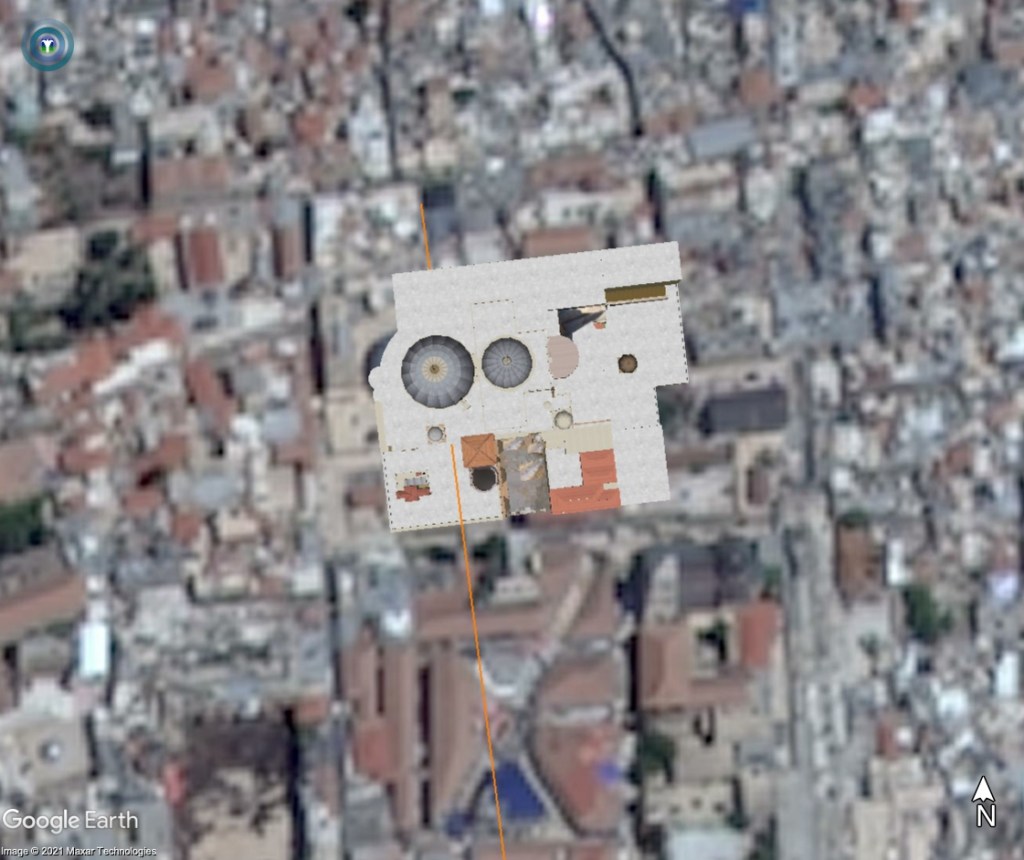
Osaka Castle is aligned in the direction of geomagnetic north circa 1500 CE, which is close to its actual date of construction of 1597. (A similar practice appears to have been used in China to align enormous earthern mounds that served as tombs and mausoleums for its rulers.) During the Tokugawa shogunate in the 1620s, several large megaliths were incorporated into internal walls. The Tako-ishi (“Octopus Stone”), which is the largest stone in terms of surface area (59.43 m²), is at the south end of the castle along the wall just inside the Sakuramon Gate. The Higo-Ishi, is the second largest stone in terms of surface area (54.17 m²) but is estimated to be heavier (about 120 tons compared to 108 tons for the Octopus Stone). It is a part of the wall just inside the northwest entrance to the castle past the Kyobashi Gate. Where the Tako-ishi is aligned east-west, the Higo-Ishi is aligned to minor lunar standstills. Two paths through the Nishinomaru Garden west of the castle are aligned to major (M) and minor (m) lunar standstills.
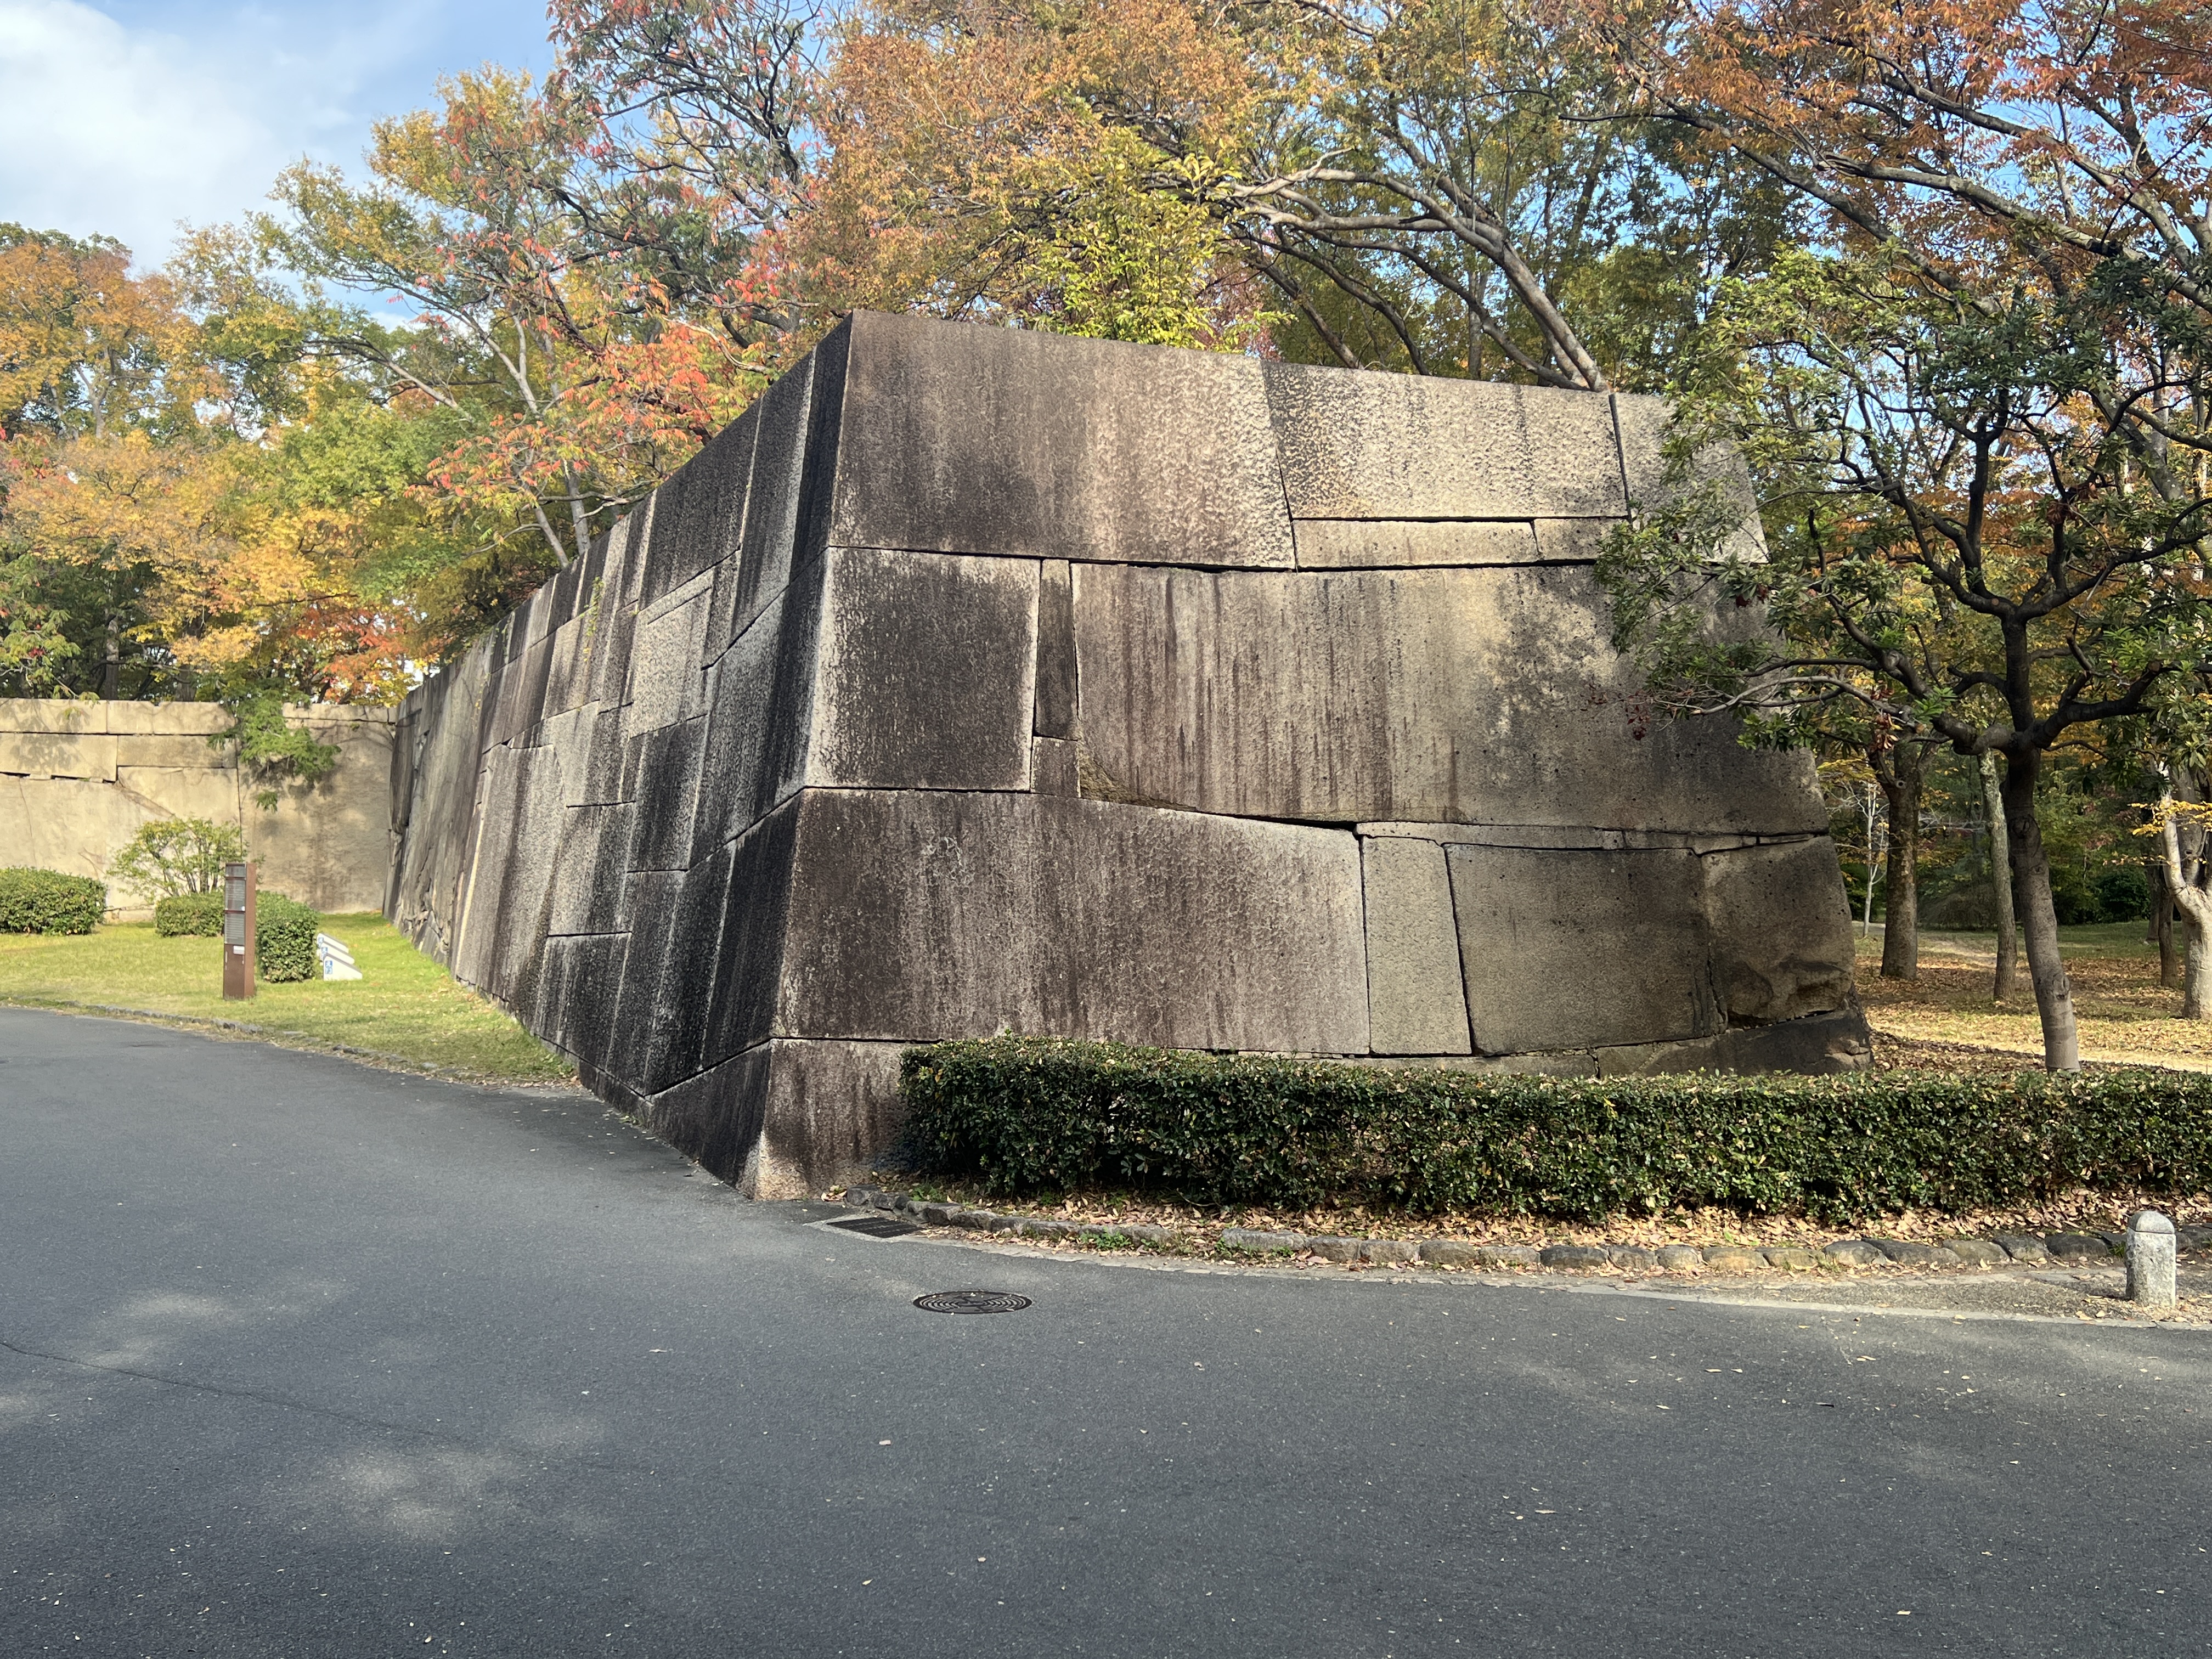
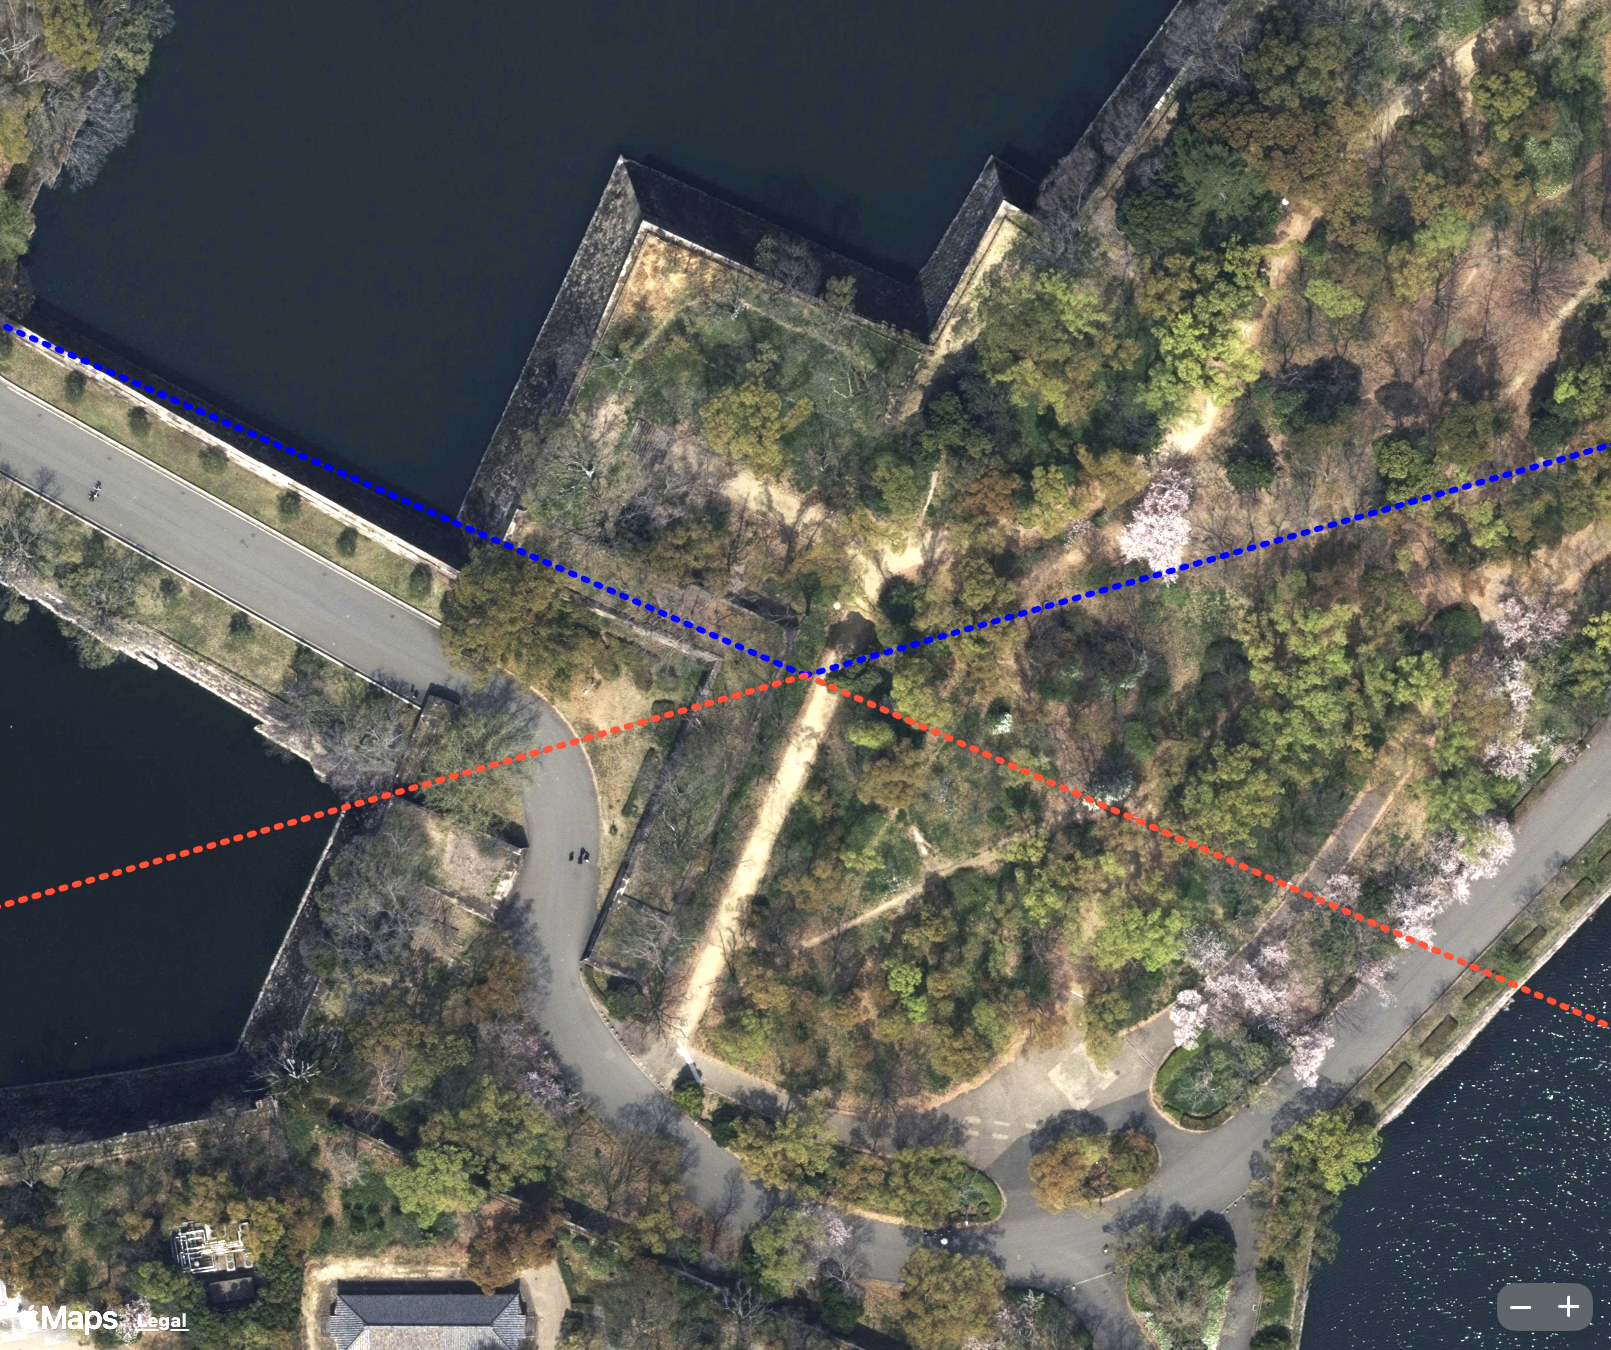
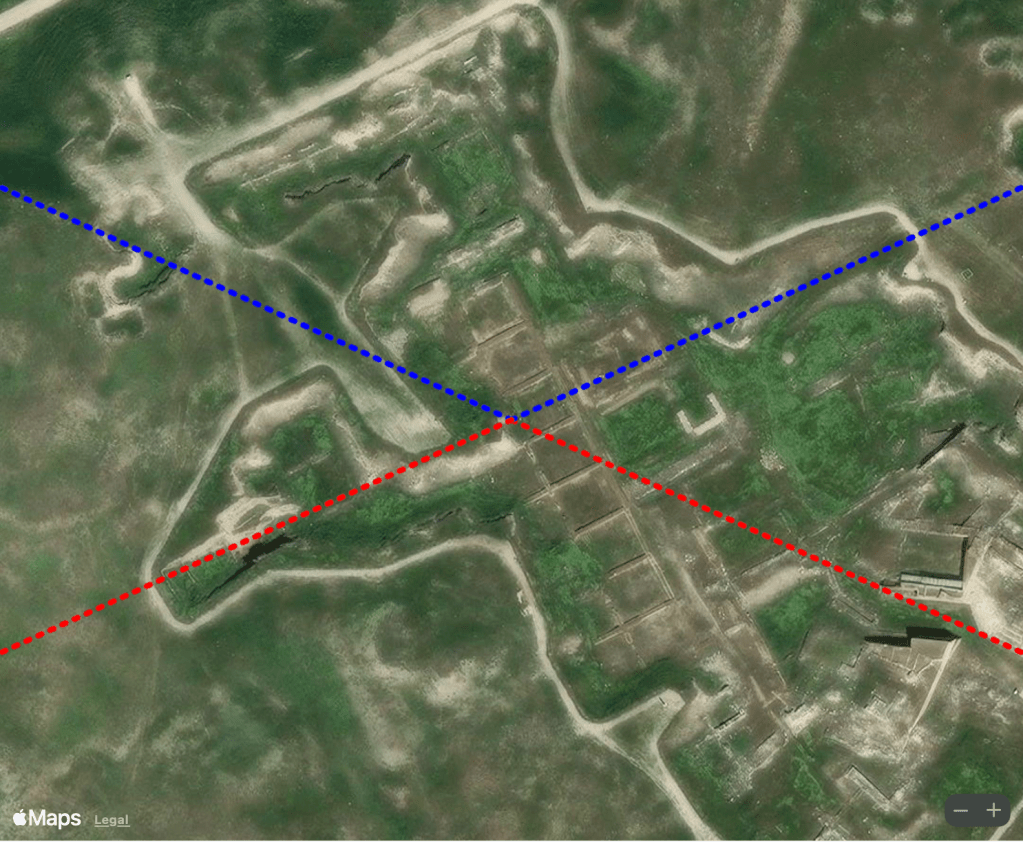
Inner castle wall that contains Higo-Ishi (left) and alignment of wall to minor lunar standstills (right). (Photo by author/Google Earth)
Ishi no Hoden
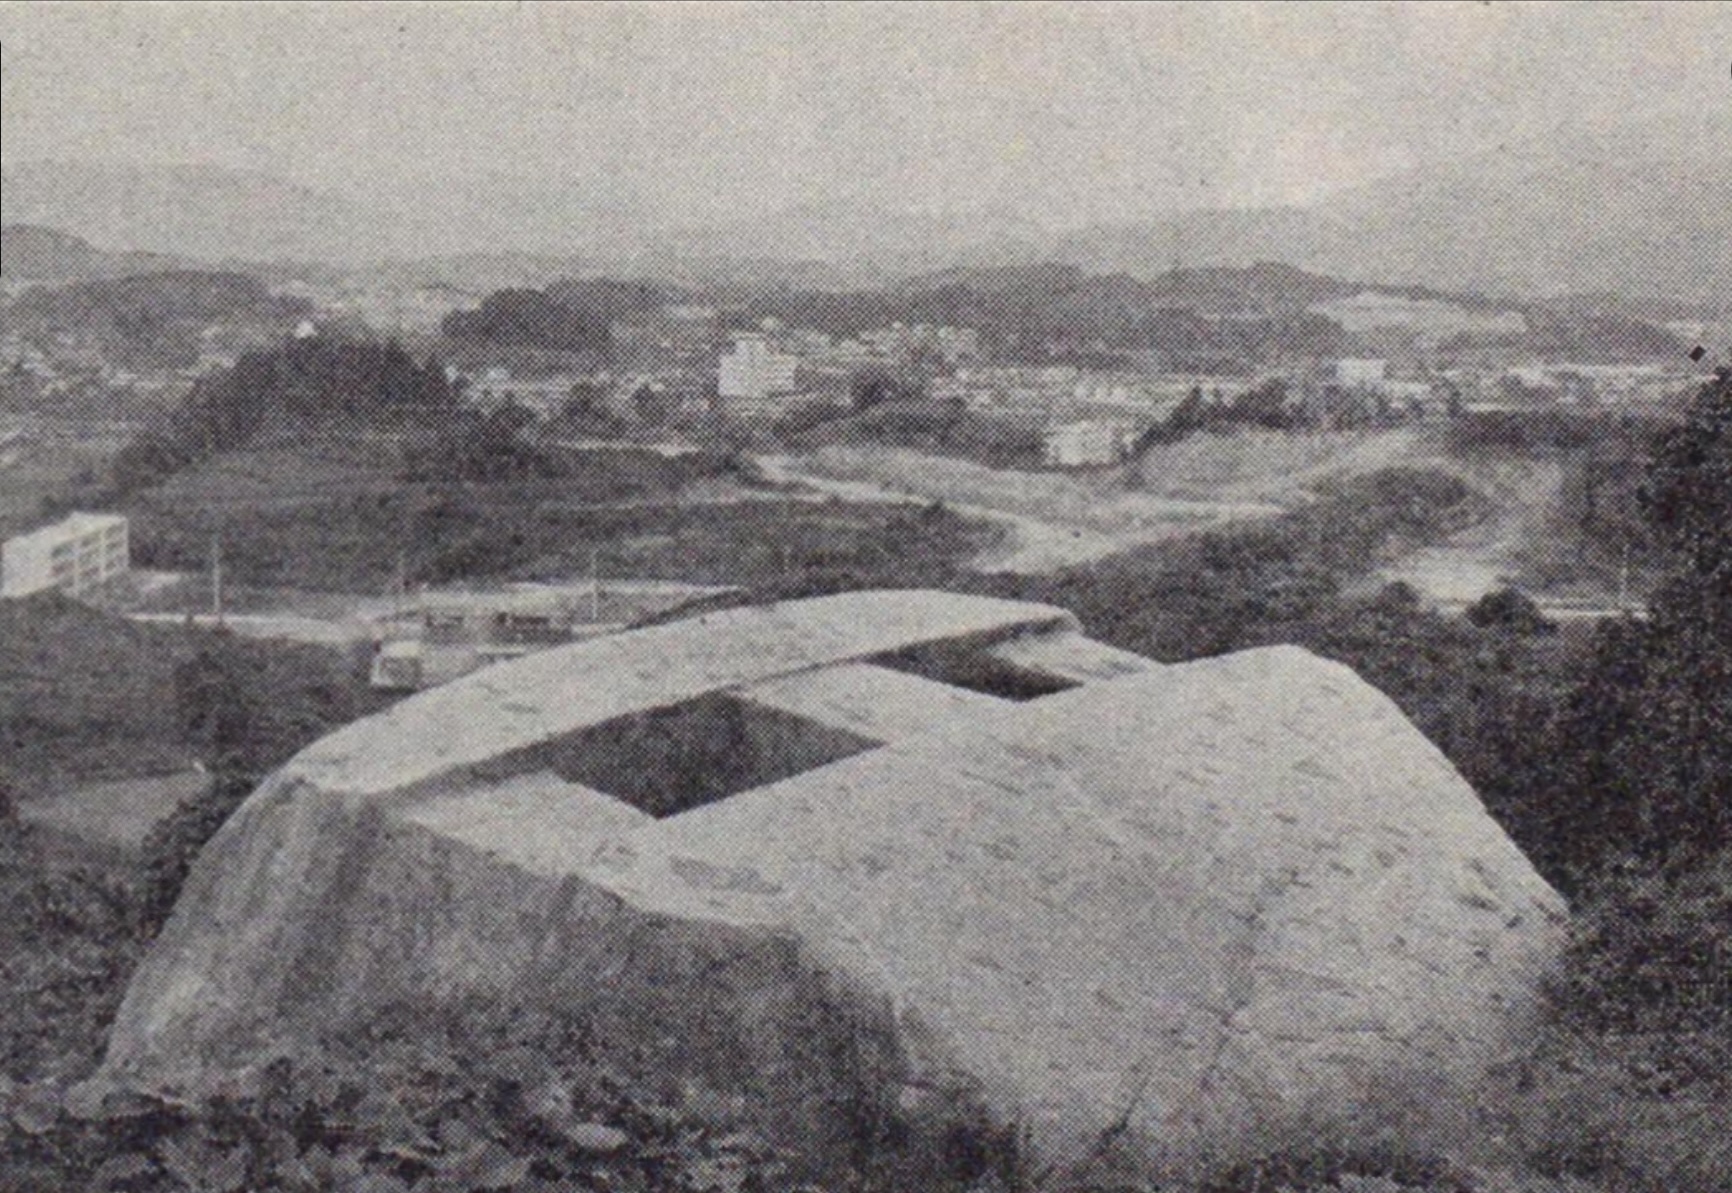
The Higo-Ishi is the largest megalith (by weight) at Osaka Castle and the third largest in Japan. Where the Higo-Ishi was quarried from islands in the Seto Inland Sea in the 17th century, the dating of the second-largest megalith is unknown. Ishi no Hoden (“Stone Treasure Hall”) is a 500-ton megalith cut from volcanic tuff in such a way as to appear to float above a pond. Philipp Franz von Siebold was the first Westerner to visit the site in 1826. The megalith is mentioned in an ancient historical record compiled from the year 713 CE onward known as the Harima Fudoki. The document says that it was built by Mononobe no Moriya, one of the strongmen of the 6th century, during the reign of Prince Shotoku, who has been considered one of the greatest figures in Japan’s ancient political history. But there is no mention of what it was for. However, the entries in the records are in conflict because Moriya died in 587 before Prince Shotoku came to power in 593.
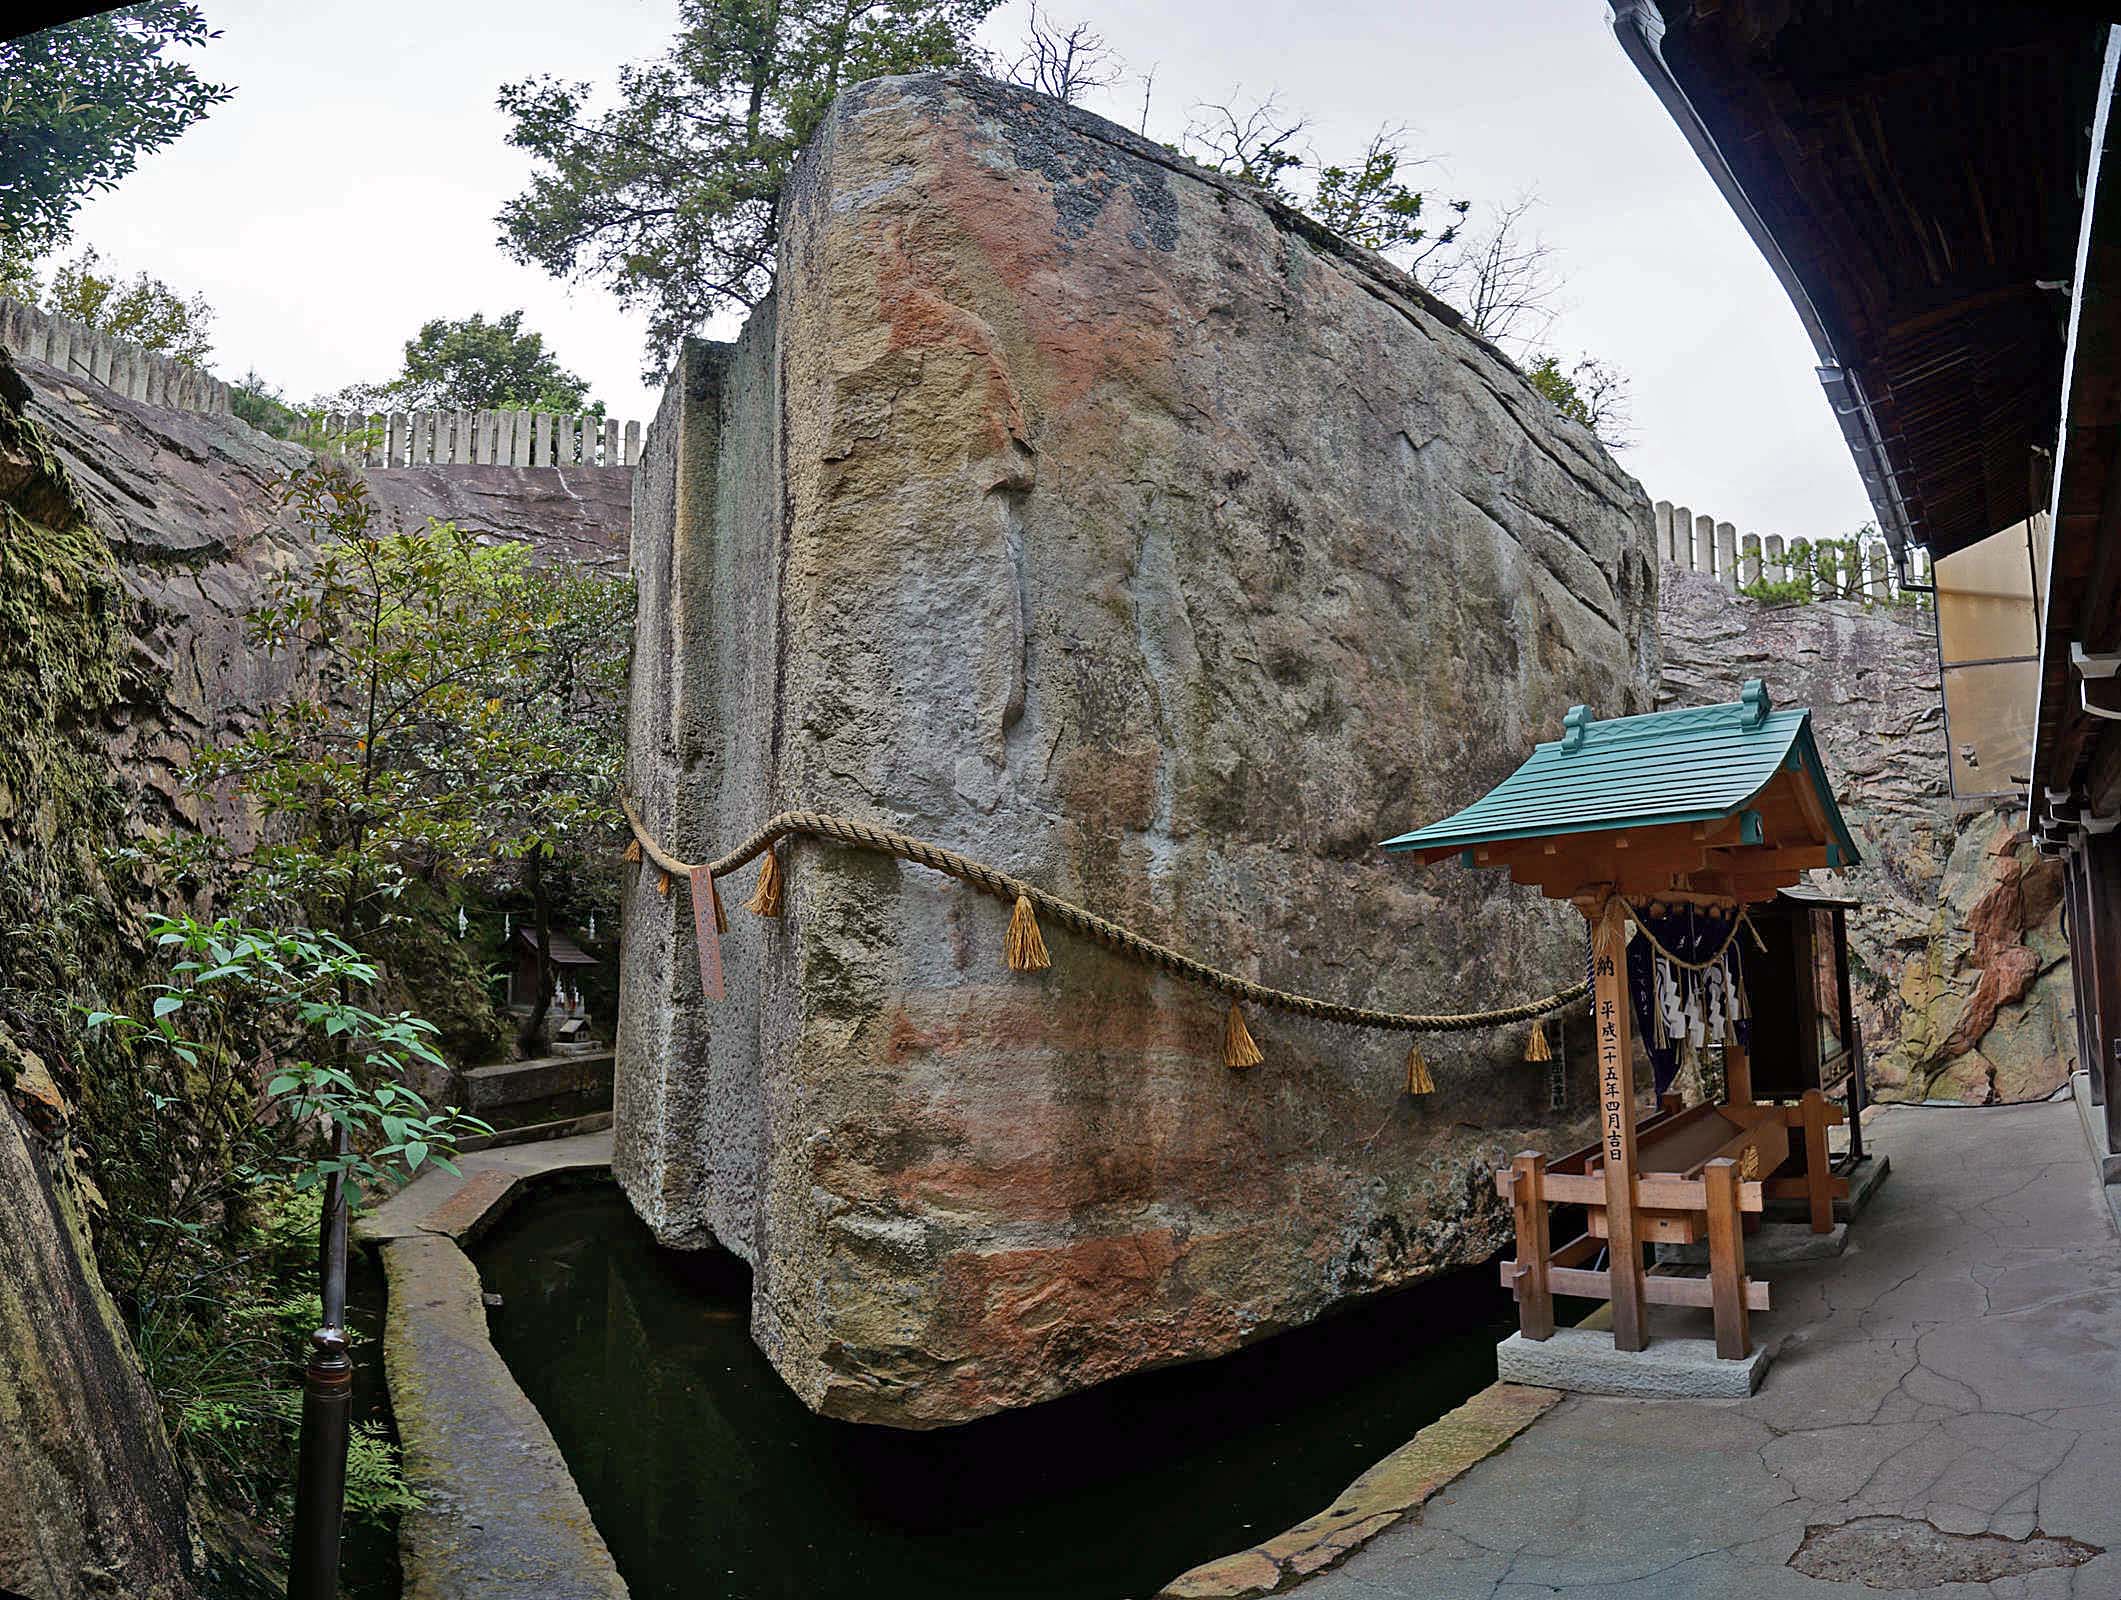
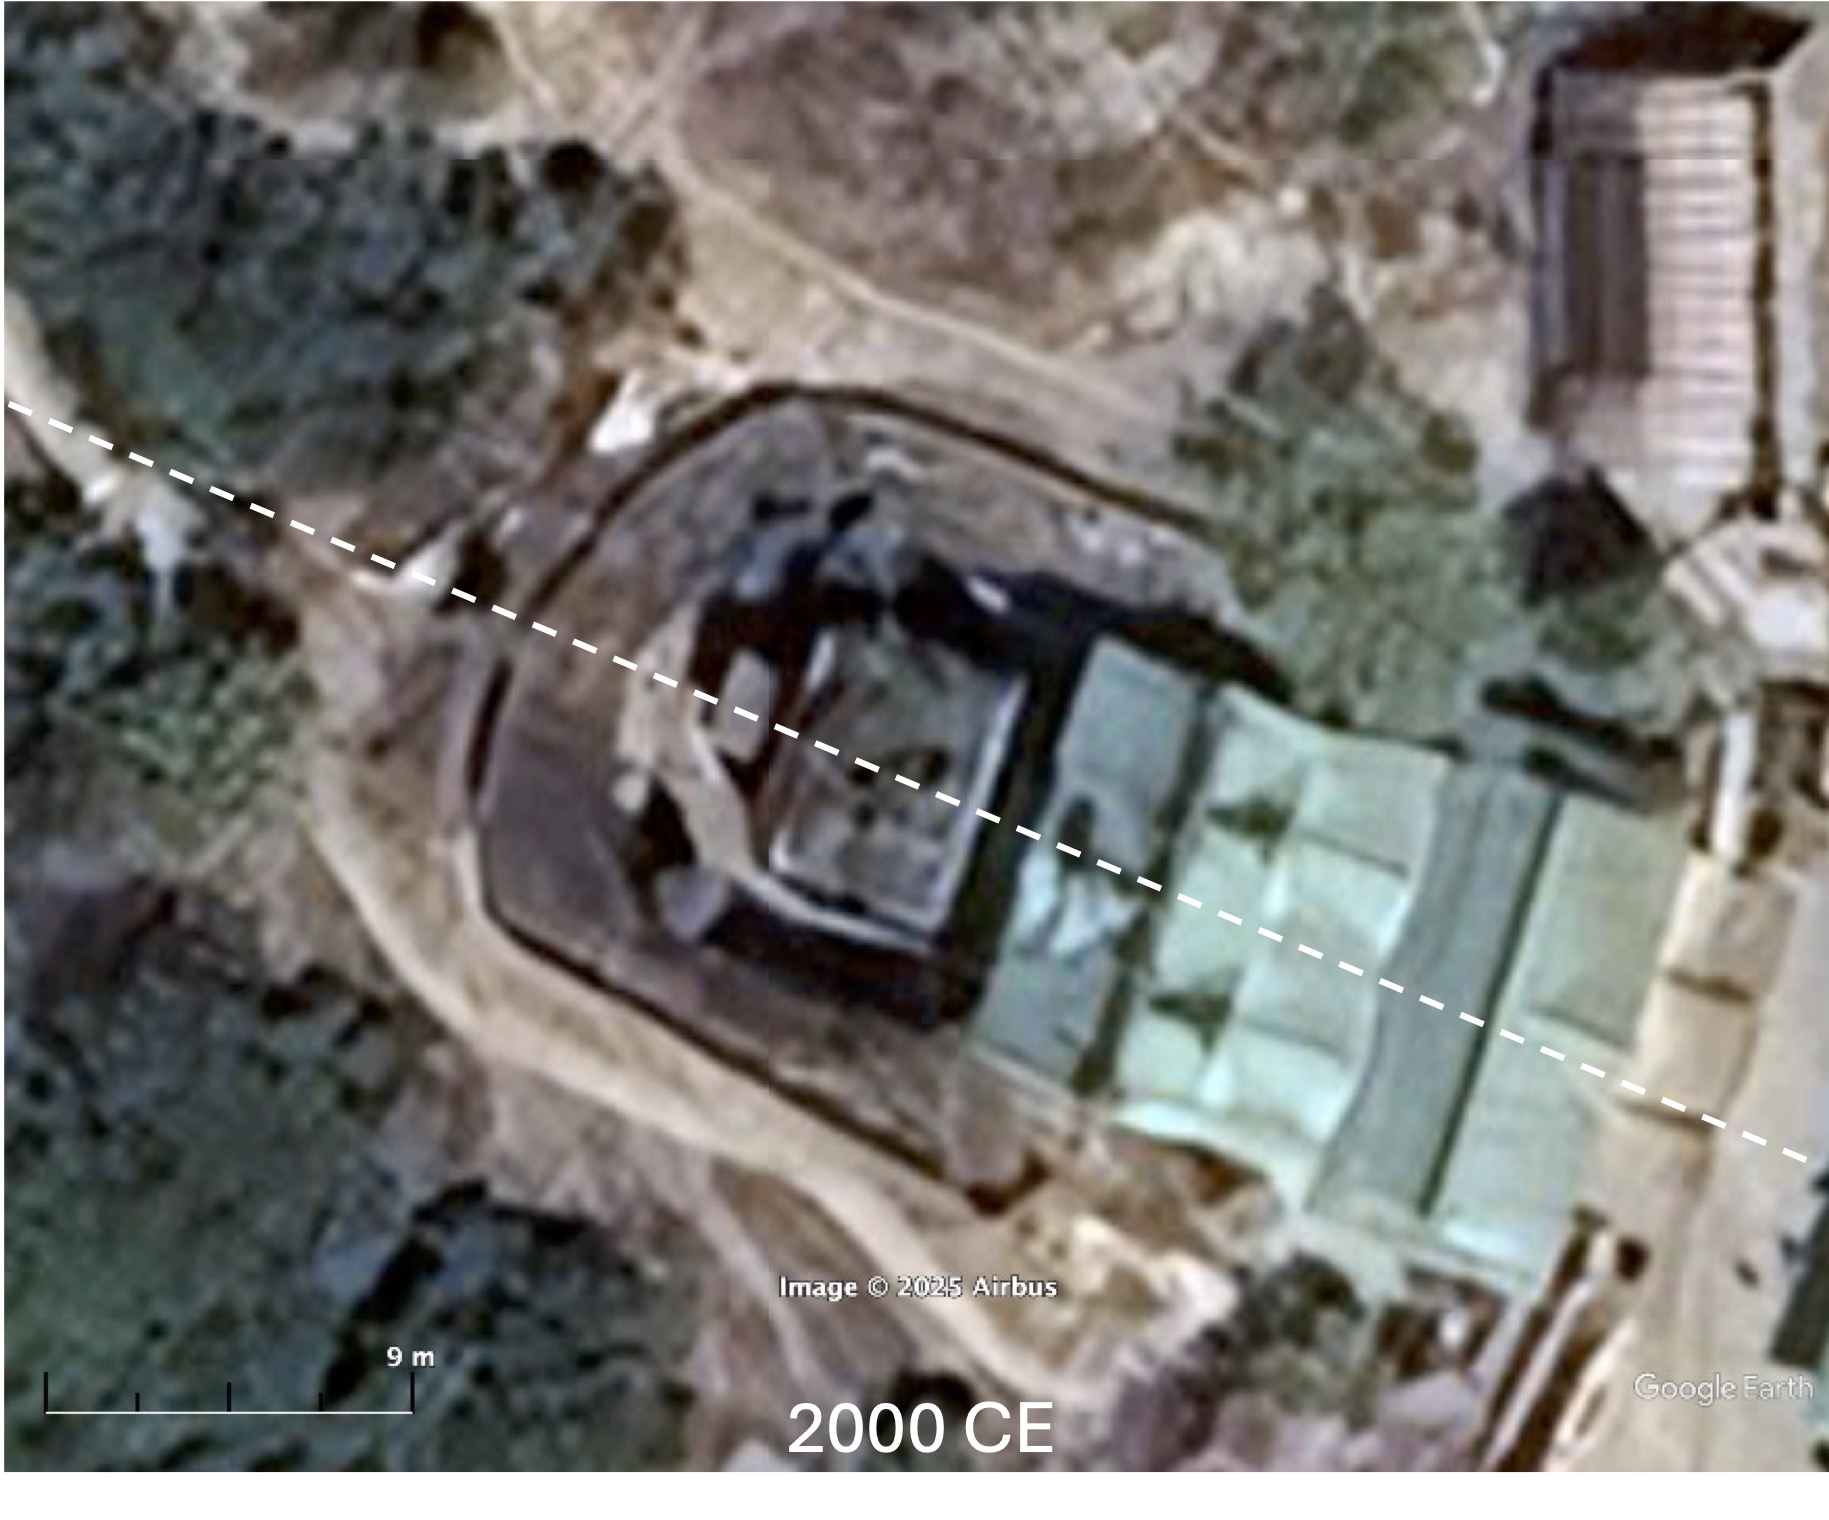
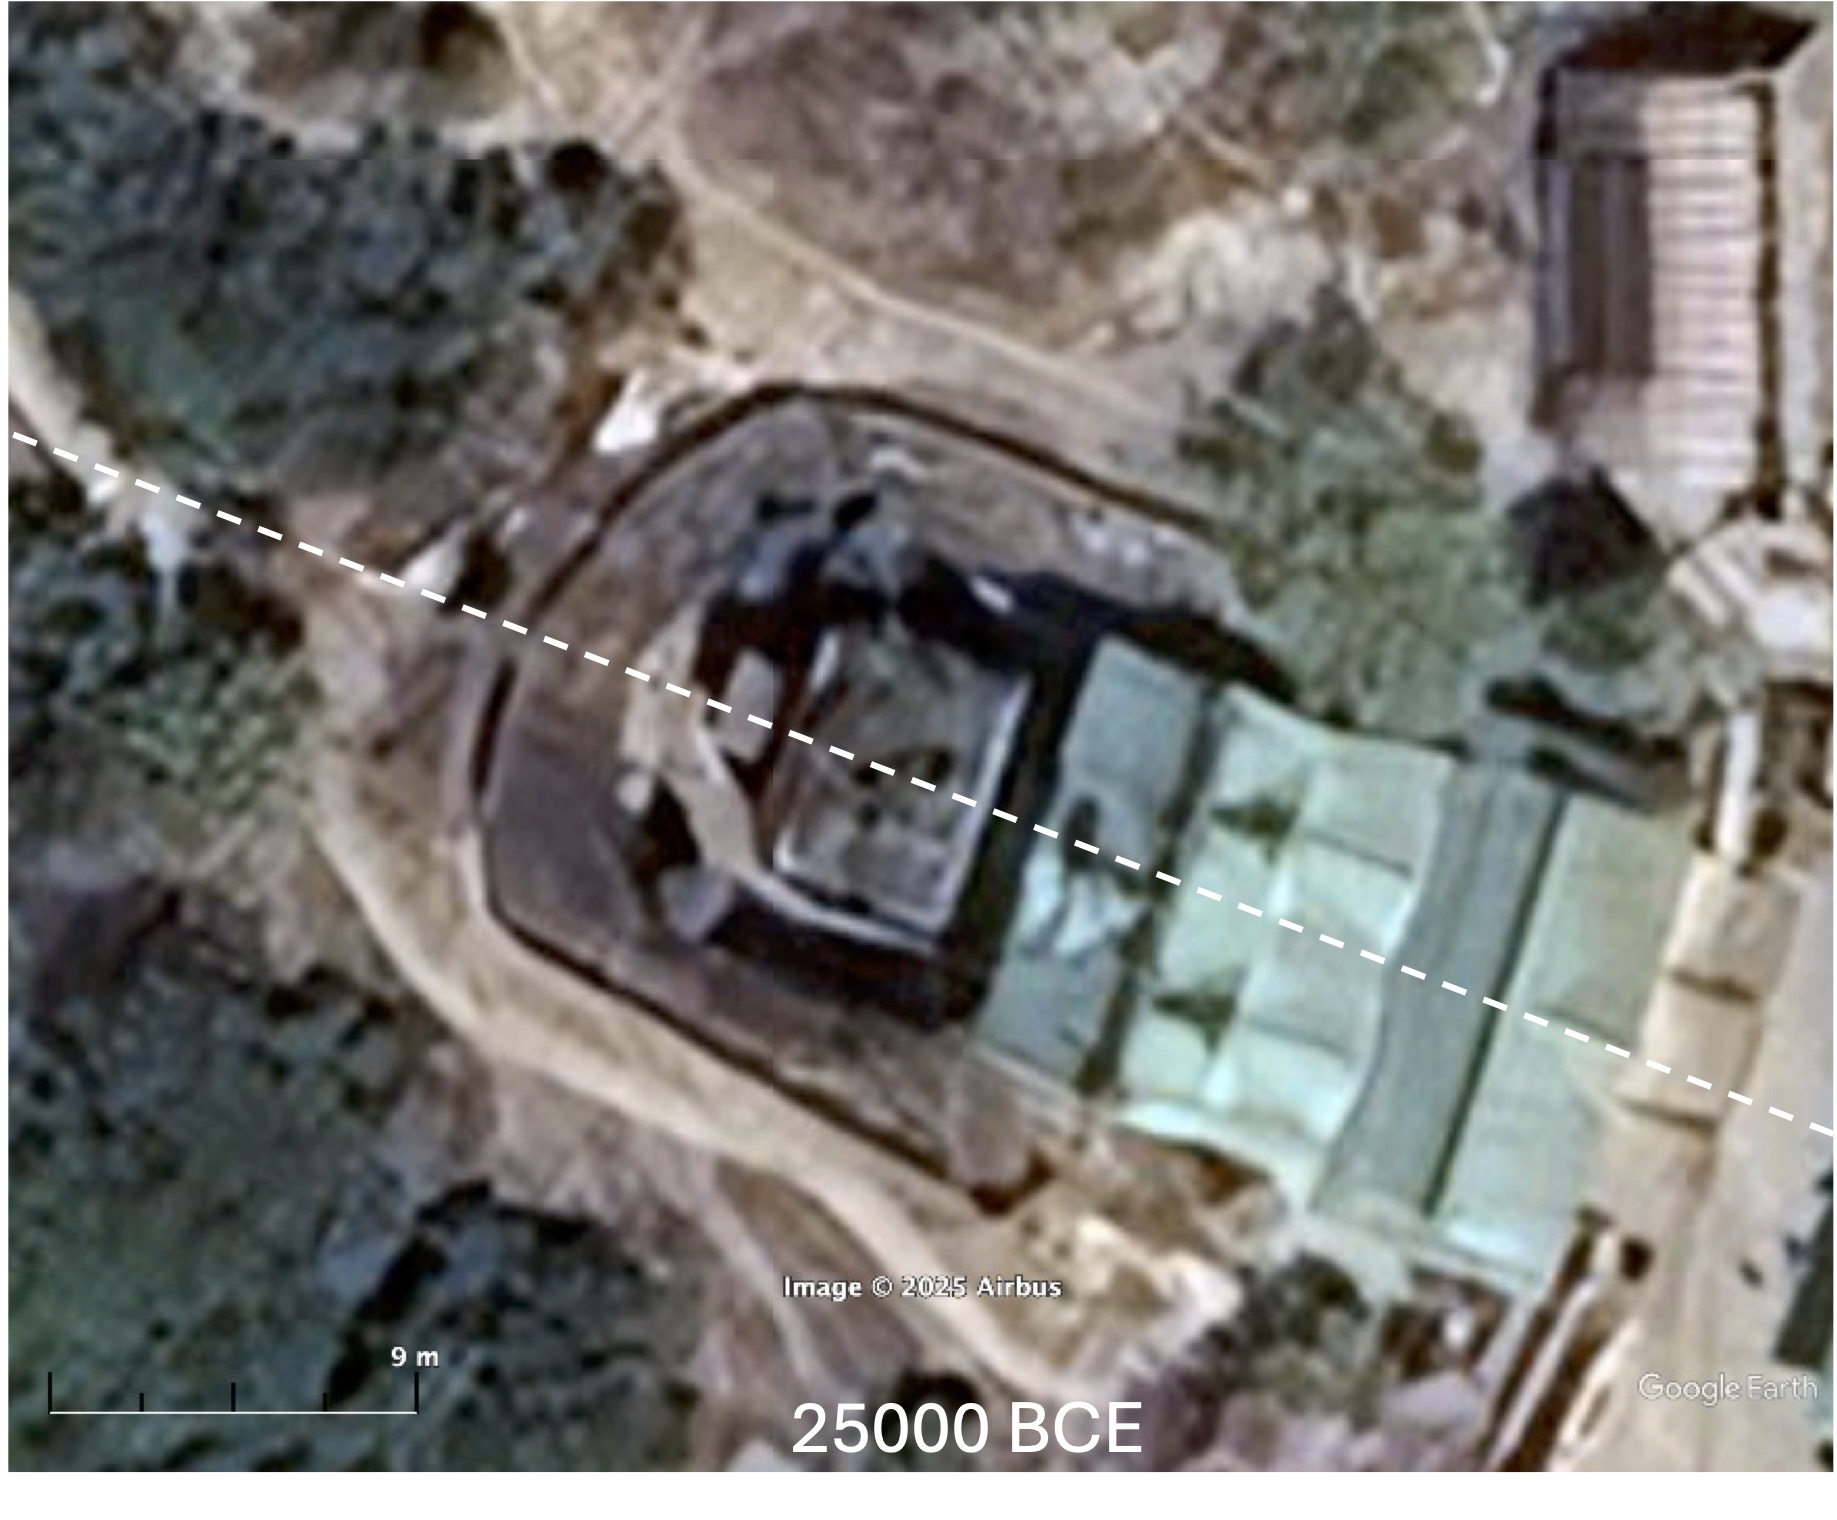
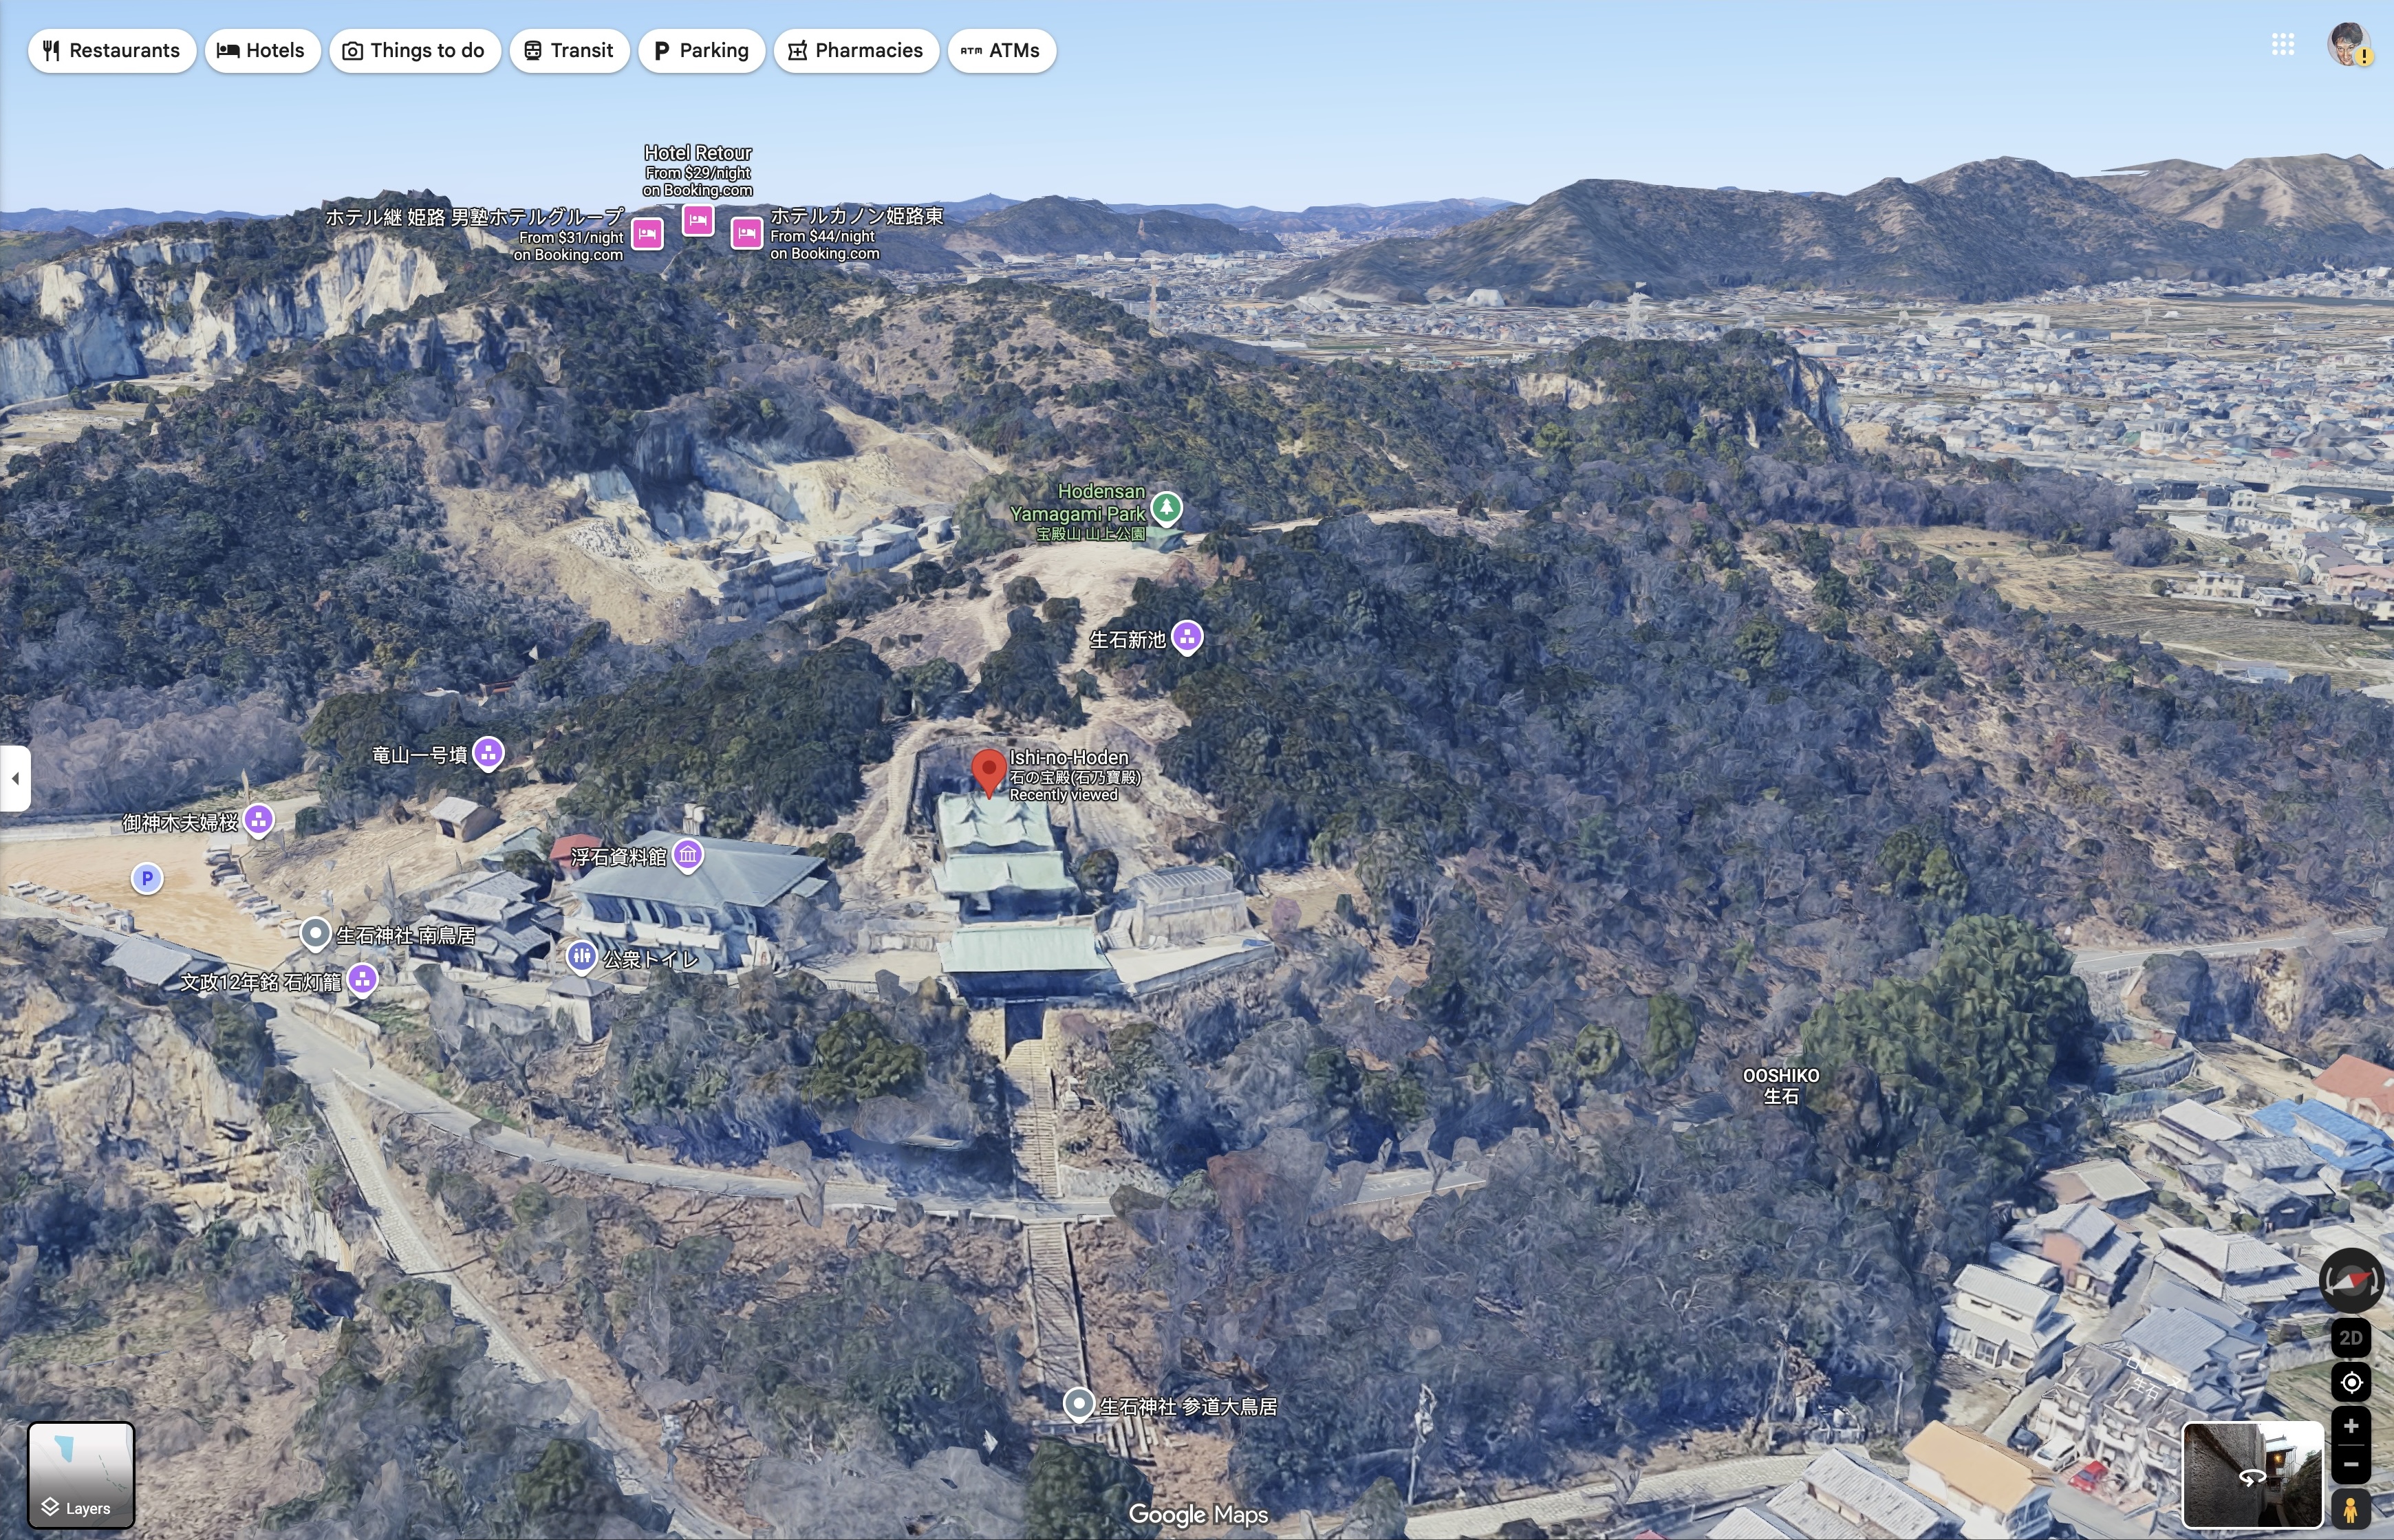
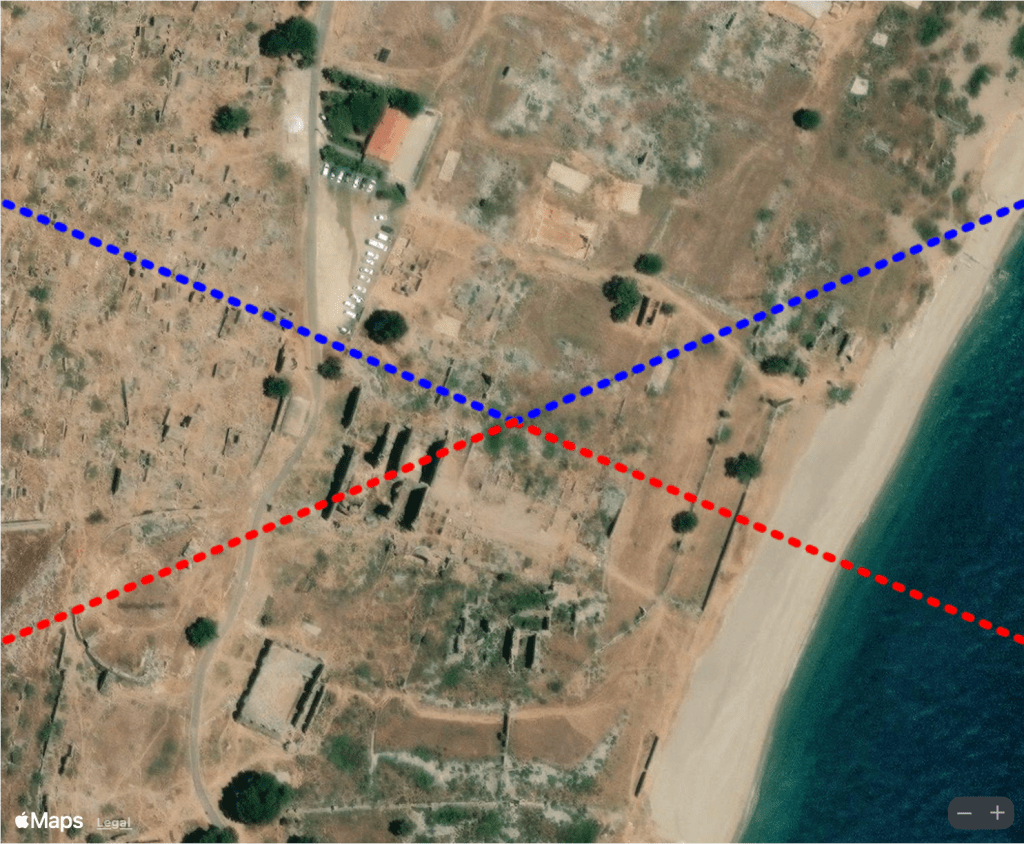
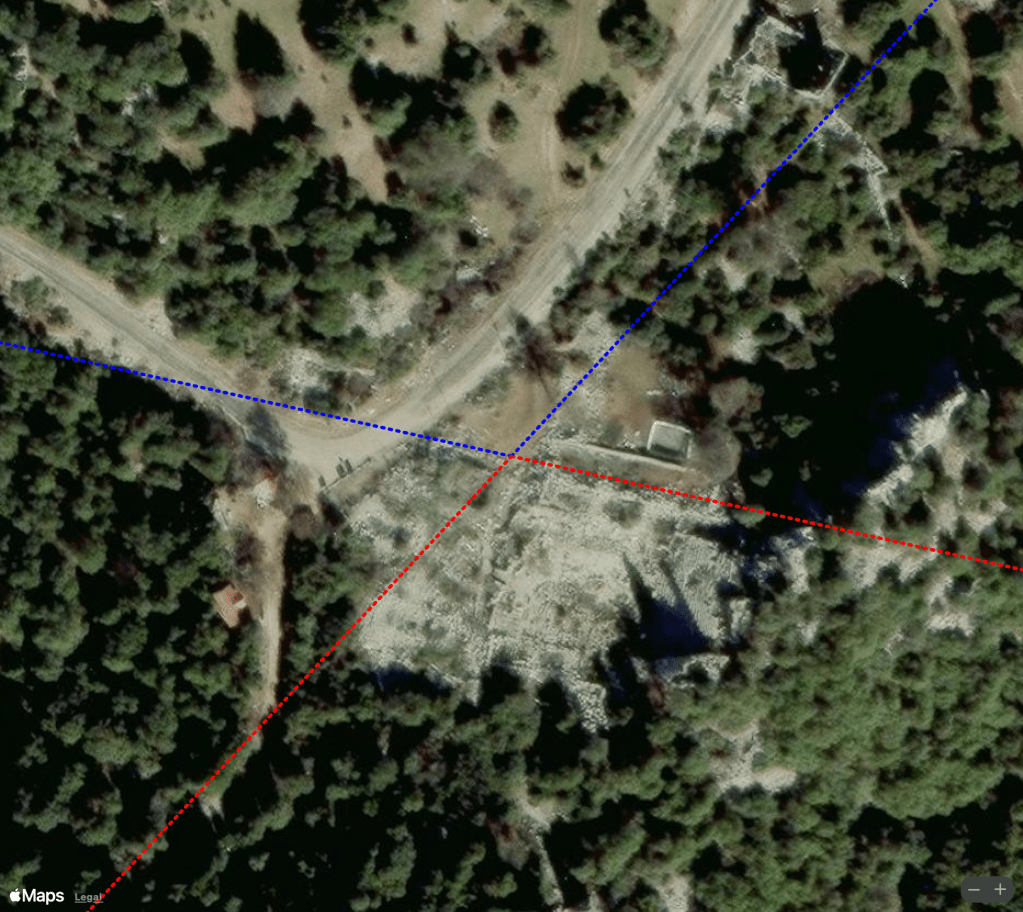
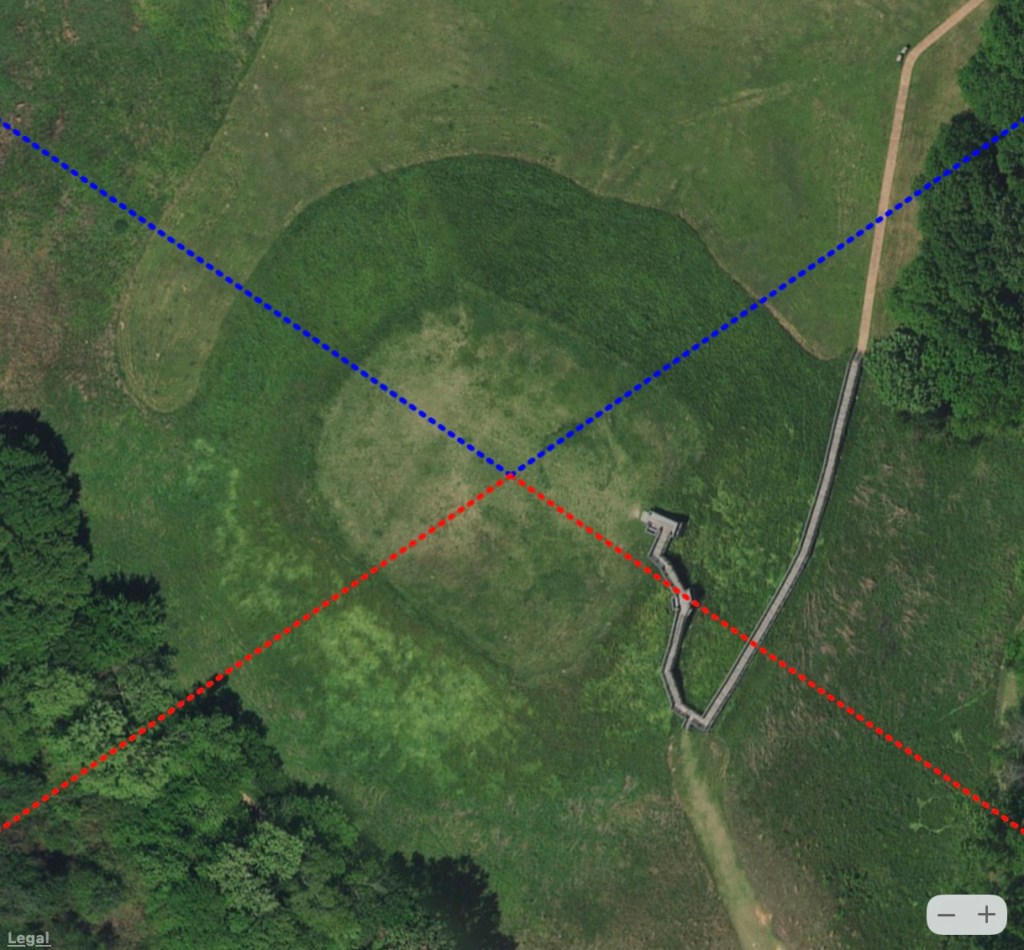
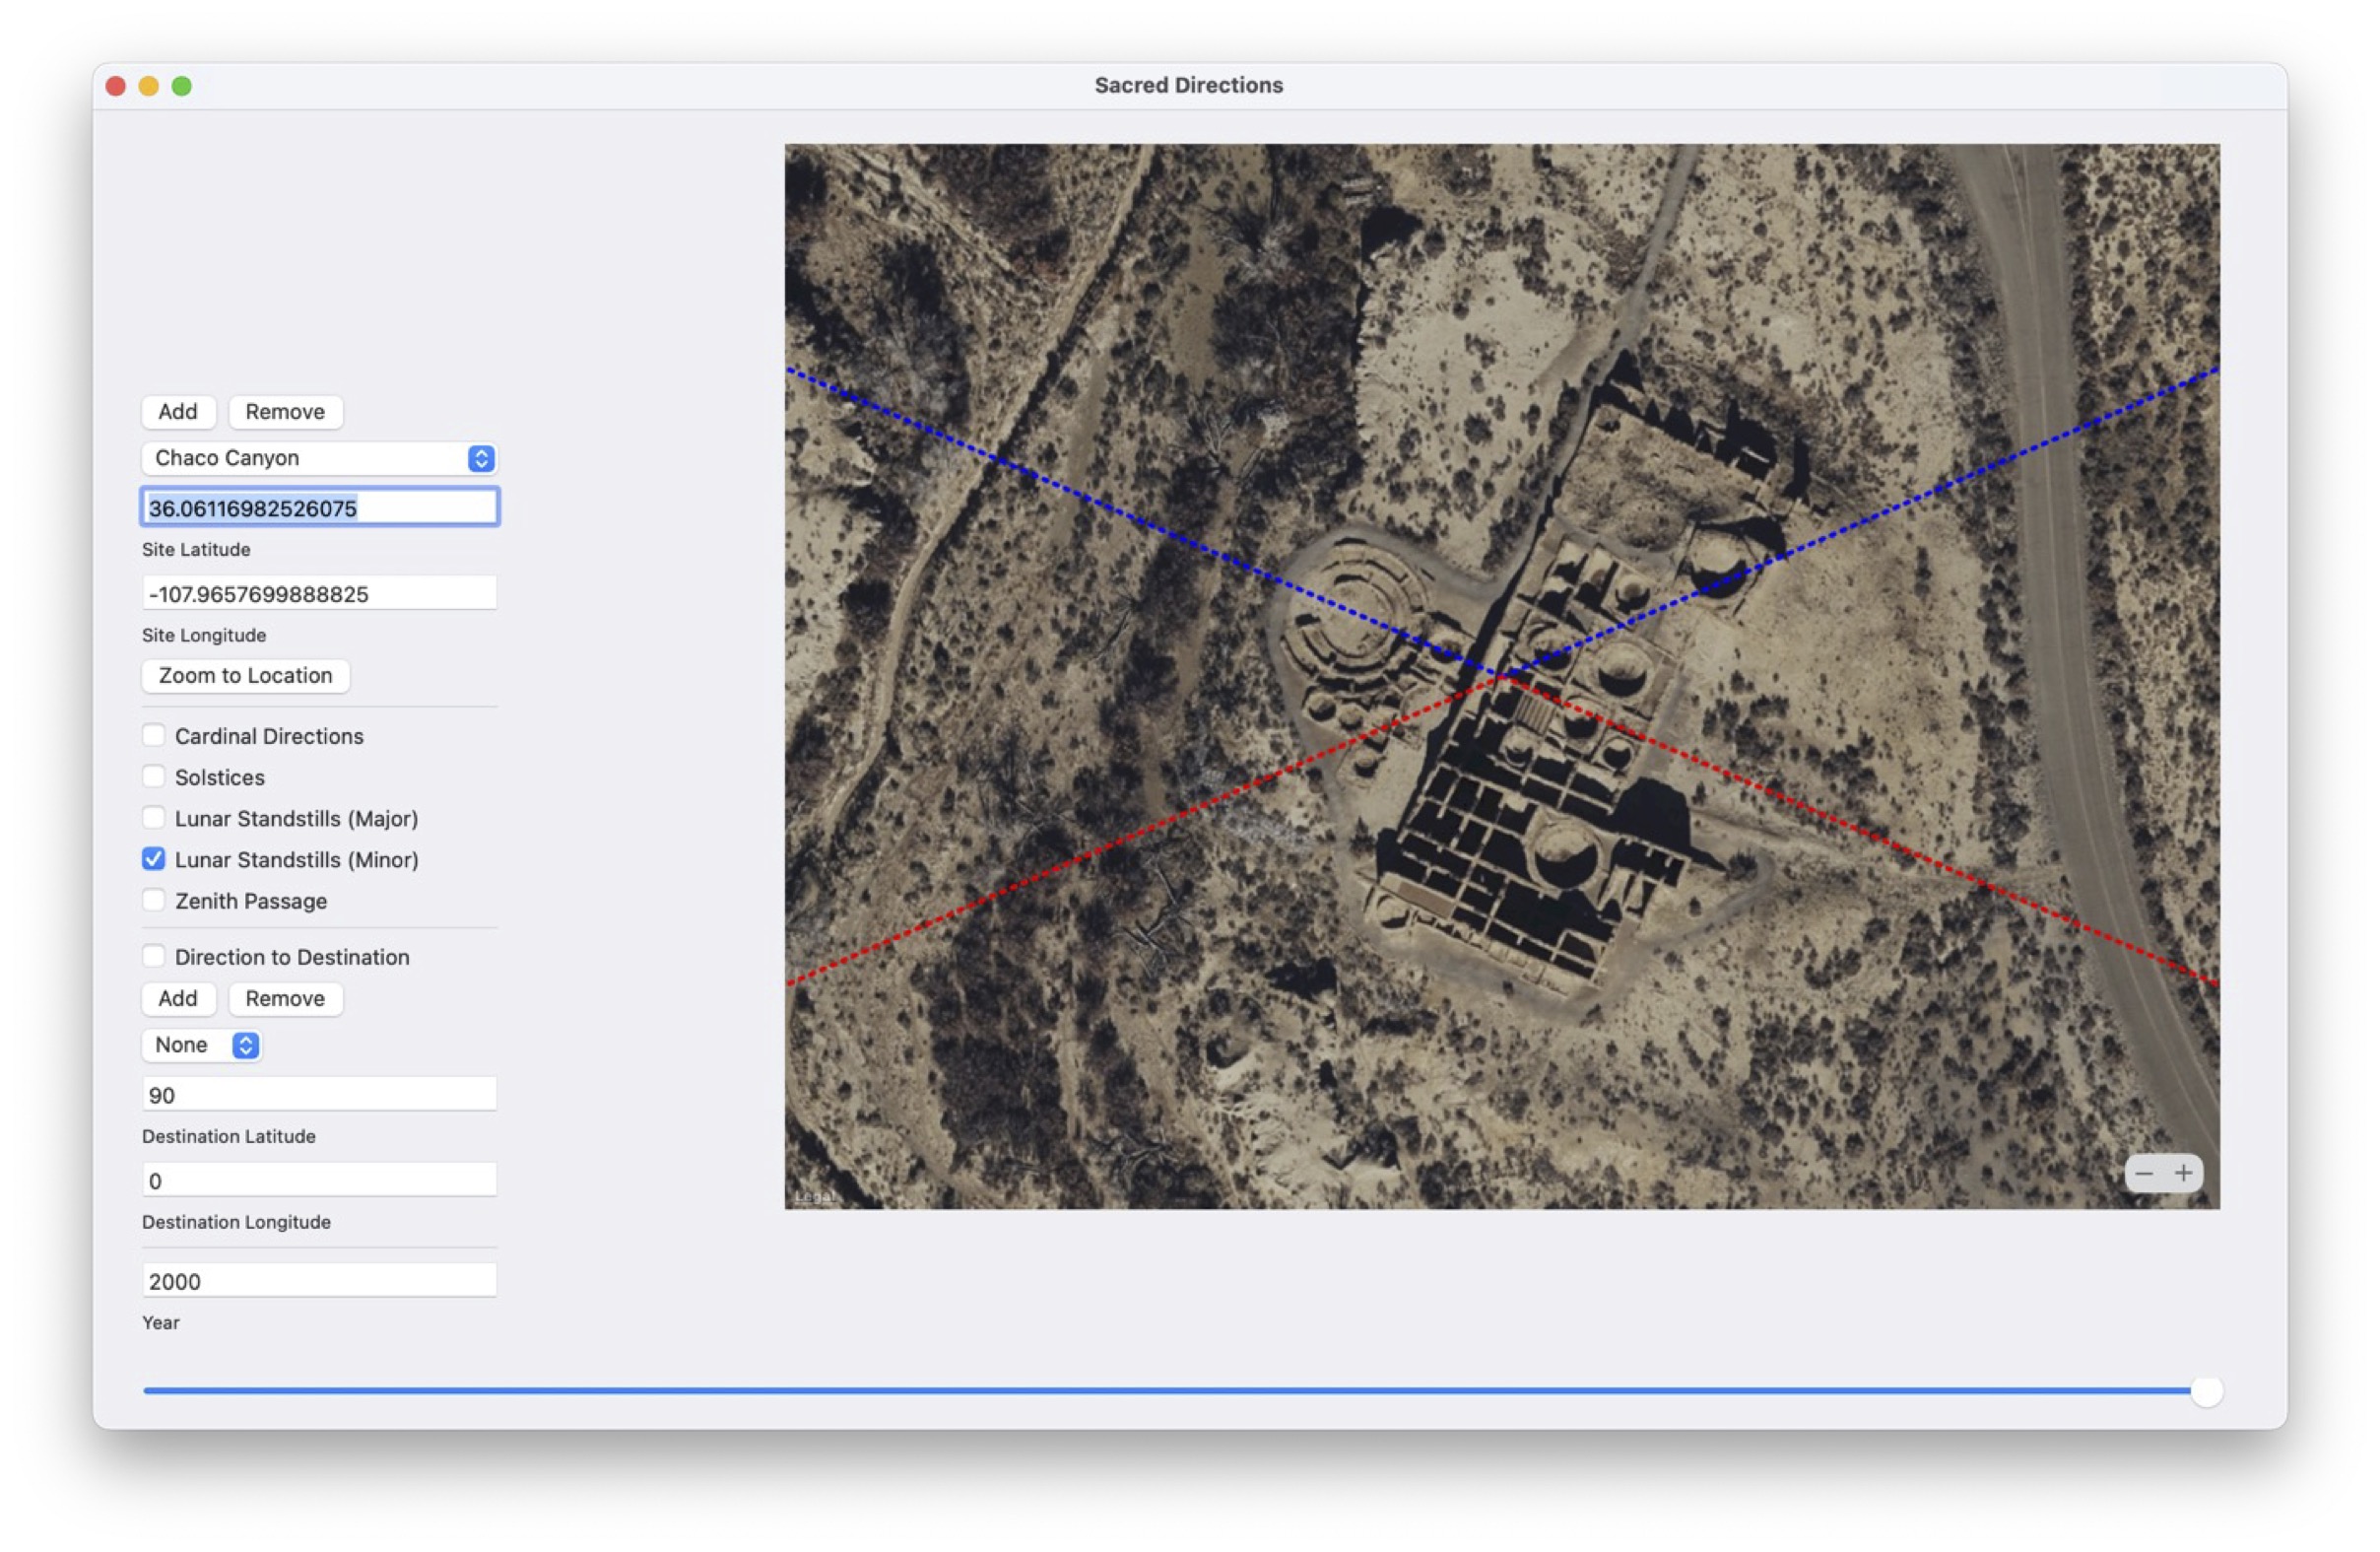
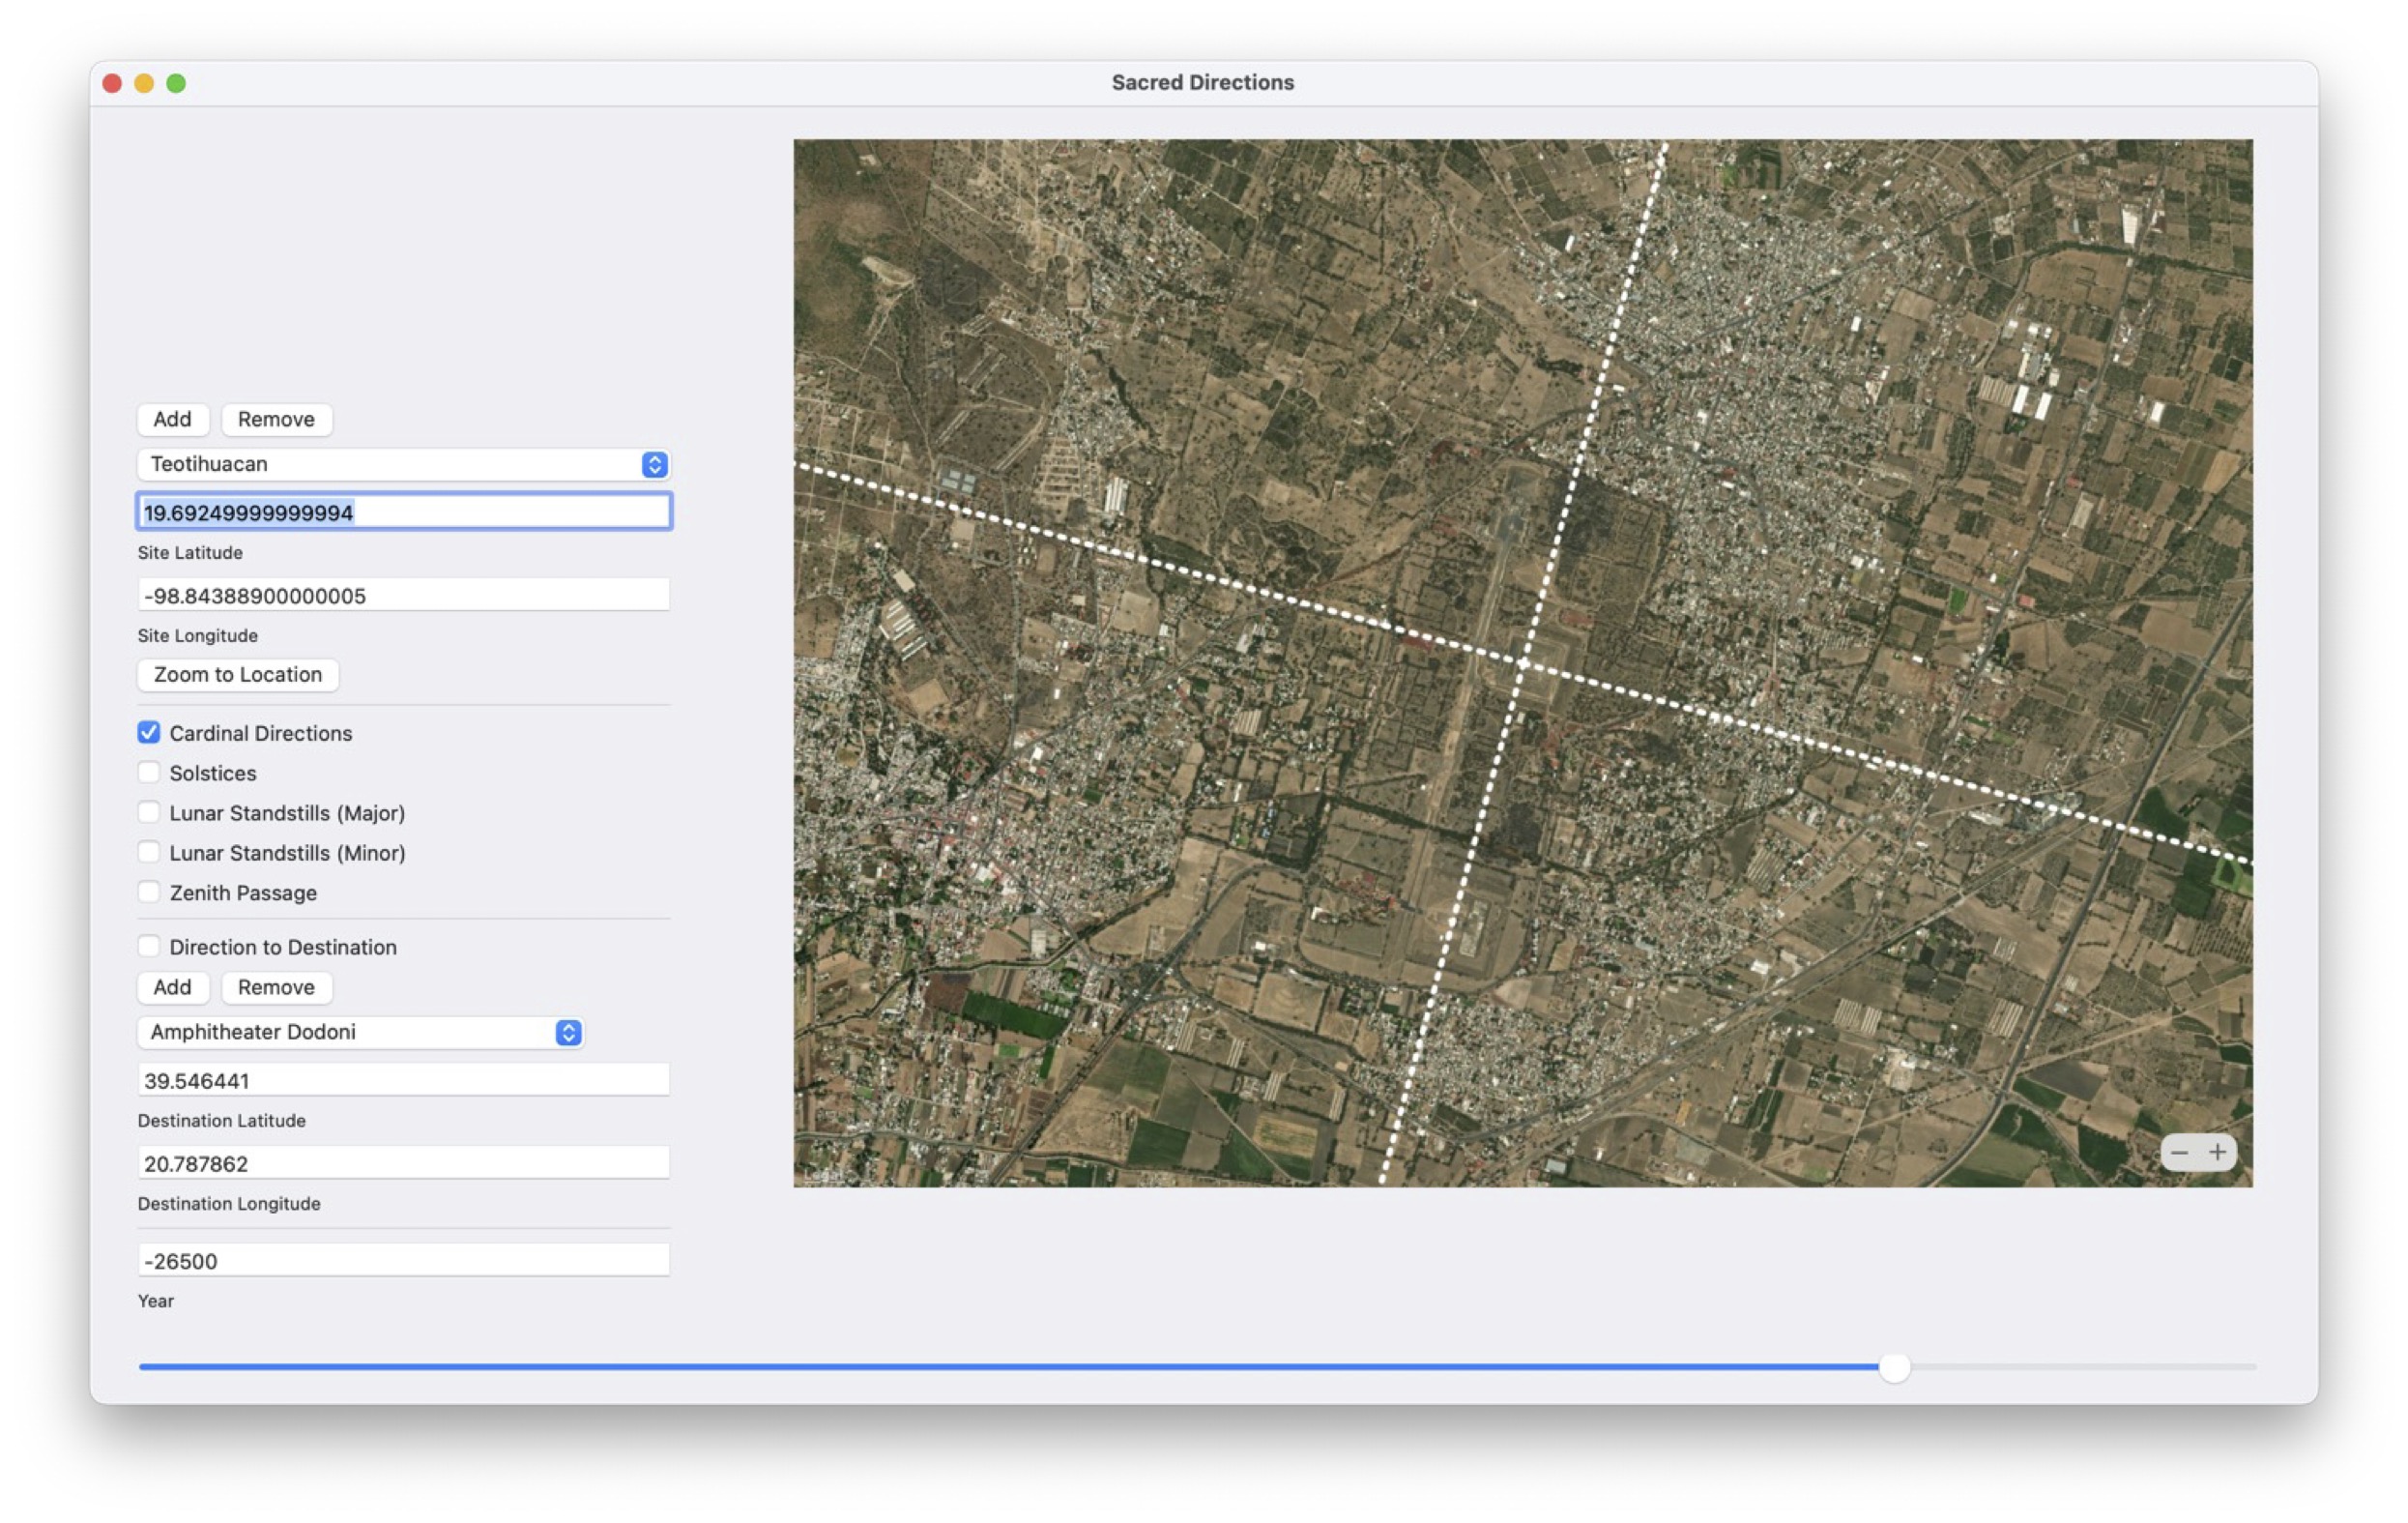
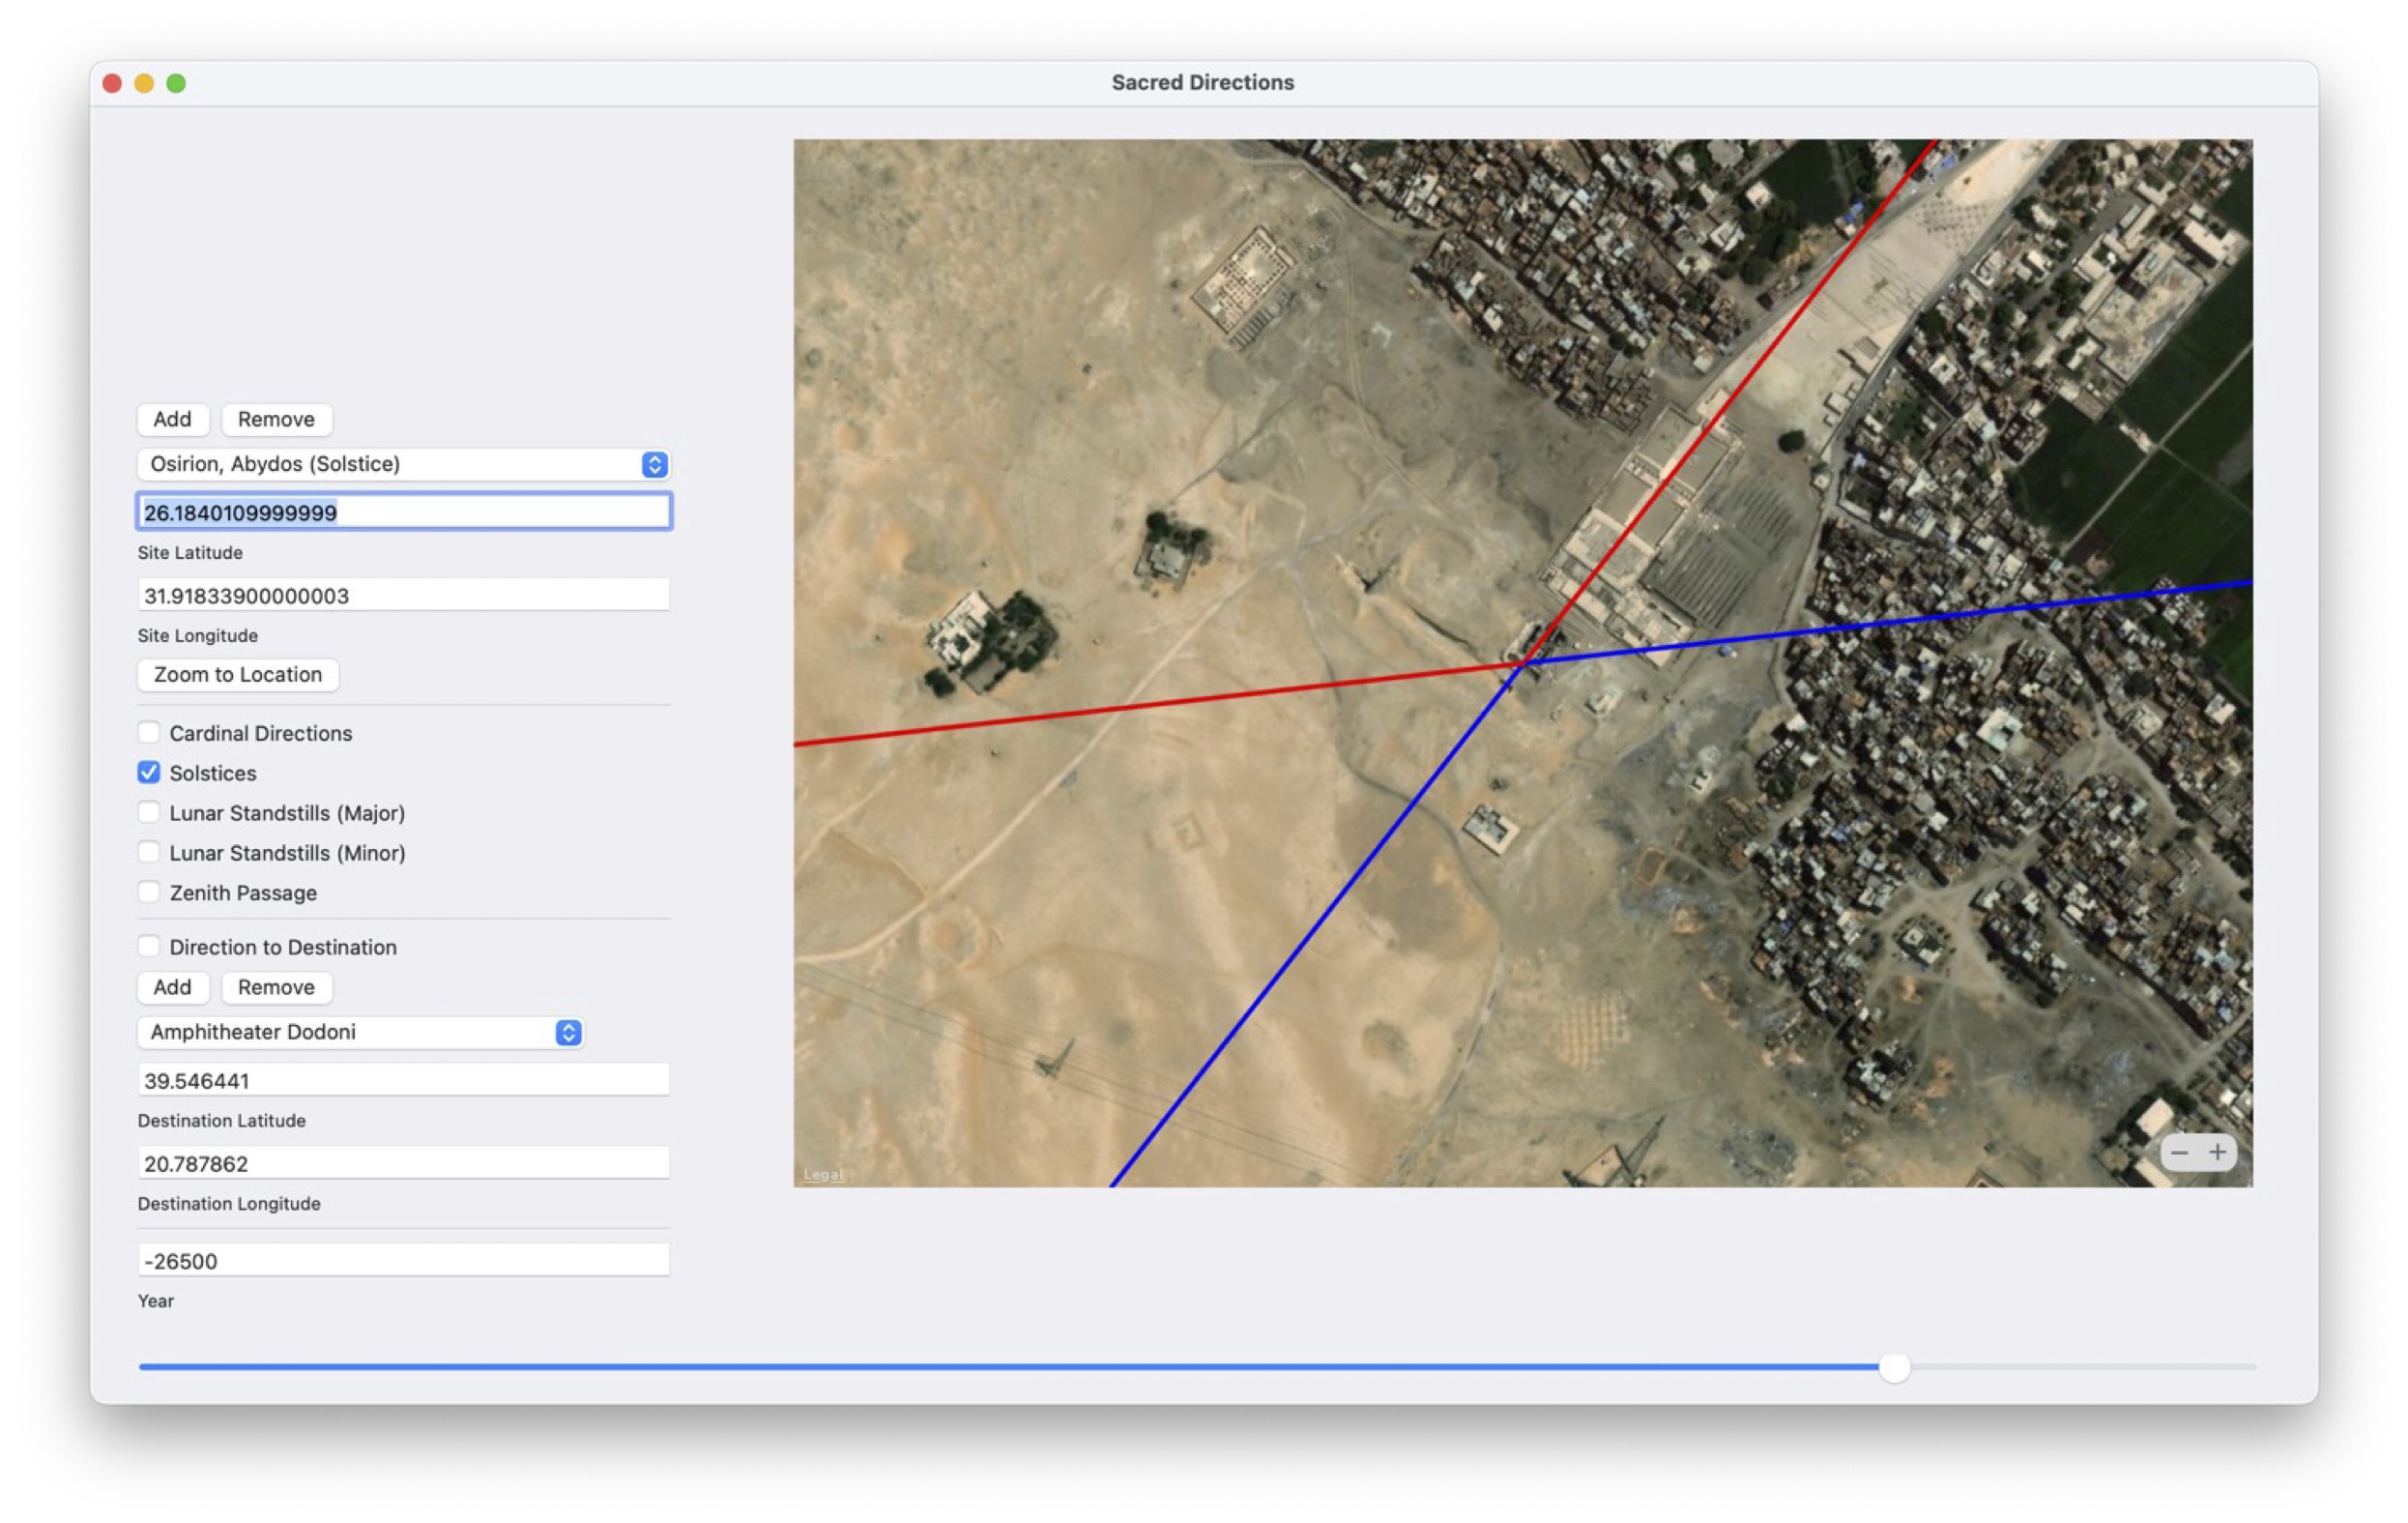
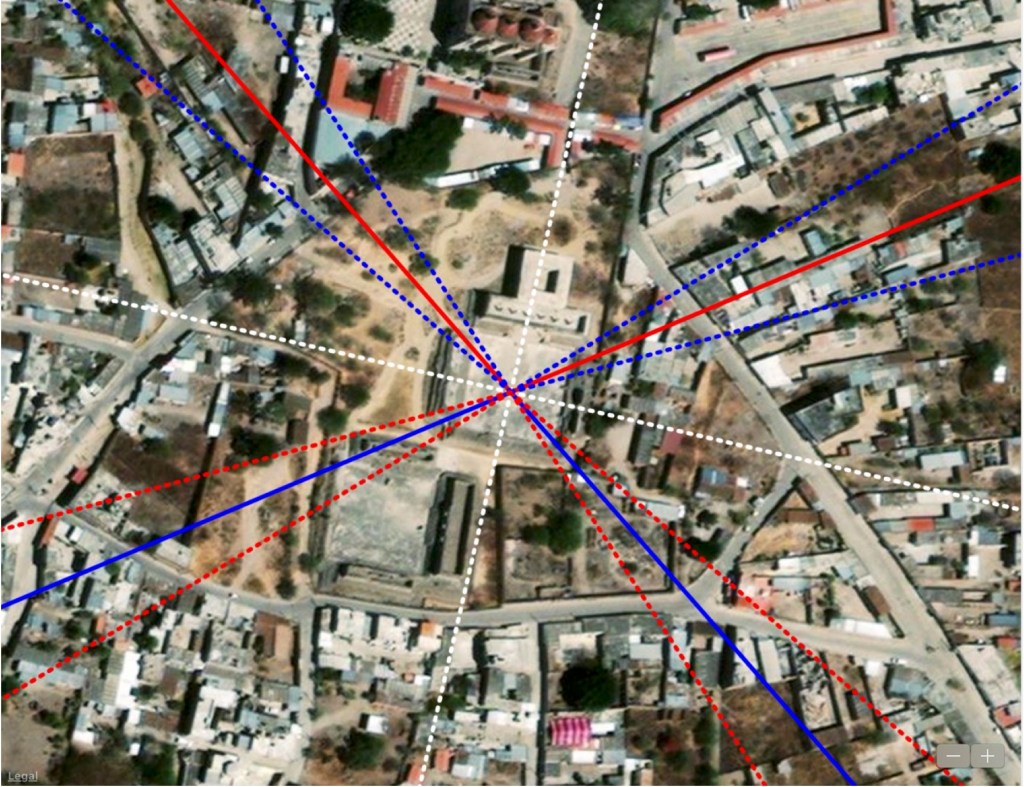
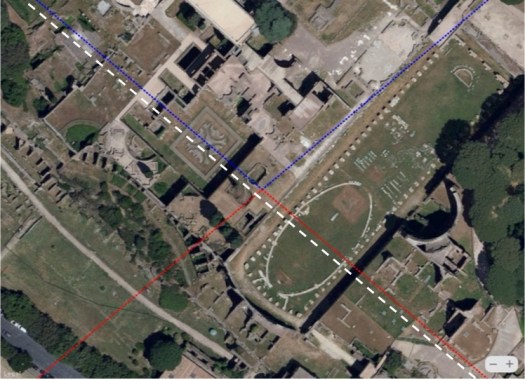
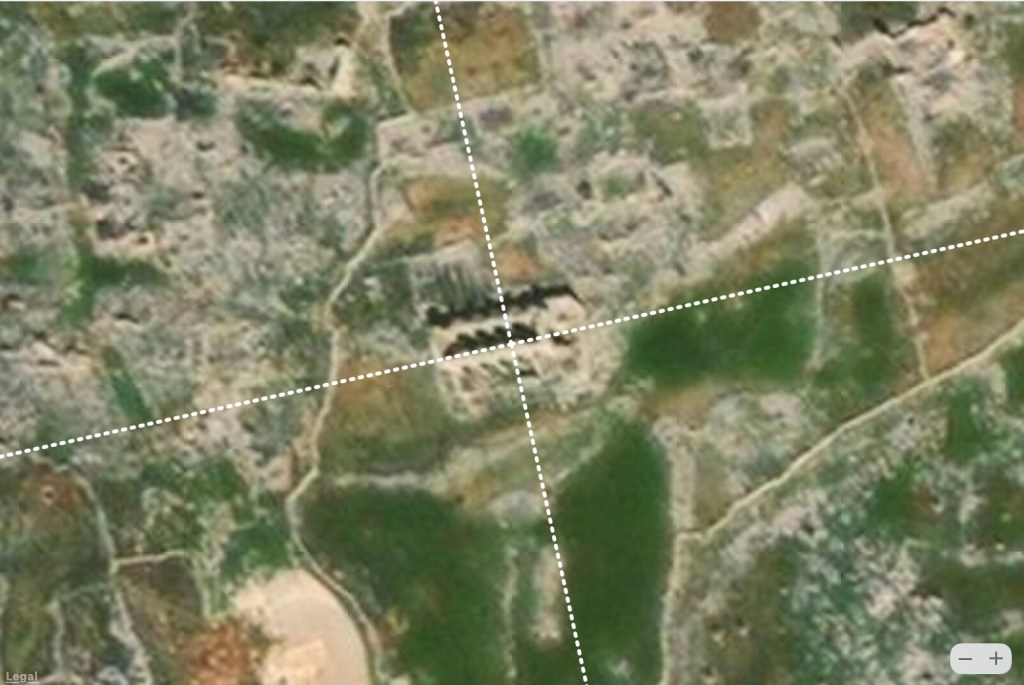
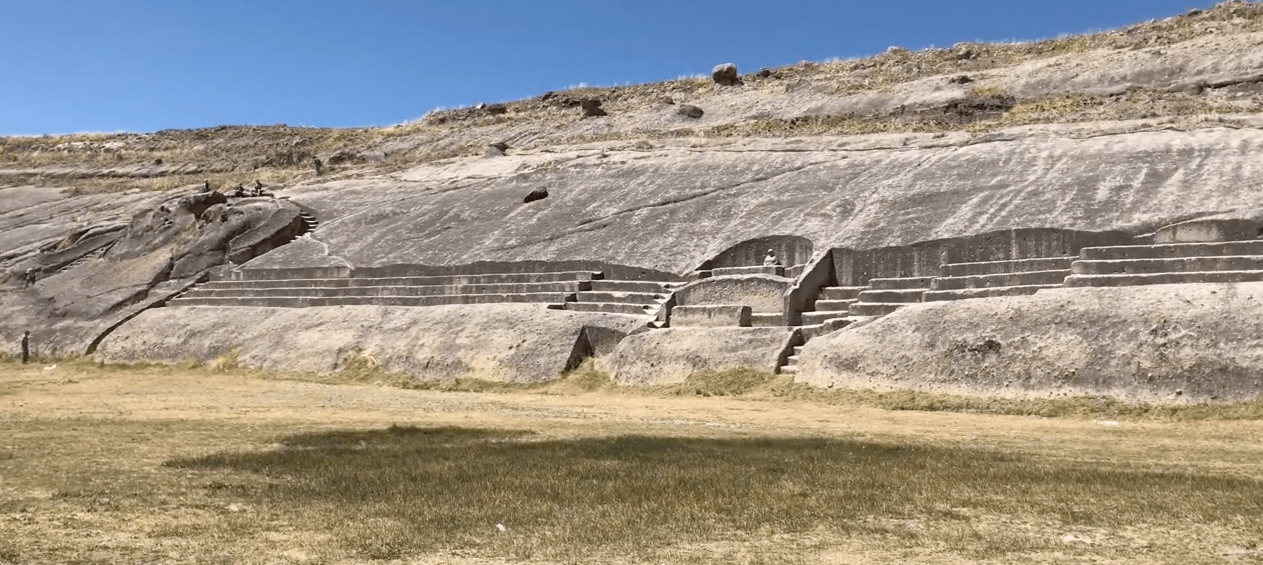
Ishi no Hoden (left) and alignments to minor lunar standstills 2000 CE (top right) and 25,000 BCE (bottom right). (Z Tanuki/Creative Commons and Google Earth)
Ishi no Hoden, which is a sacred object of the adjoining Oshiko Jinja Shinto shrine, is rotated about 20° south of east. Unlike the Shimogamo Shrine and Kenninji Temple that are rotated to view sunrise over an elevated horizon on the equinox, there are no hills or mountains immediately east of Ishi no Hoden. Its north-south axis is also well outside the range of magnetic declinations over the past 10,000 years. There is, however, another possible astronomical explanation for its orientation. As shown above, the megalith separated from the surrounding bedrock appears to be roughly aligned in the direction of minor lunar standstills.
Lacking specific evidence, Ishi no Hoden is traditionally dated to the Kofun Period. Kofun alignments in the direction of minor lunar standstills suggest the Moon’s 18.6-year Metonic Cycle was known in Japan at that time. Although volcanic tuff is relatively easy to cut and shape compared to granite, there are no other known sites in Japan where a structure of this size was cut out of the native rock and shaped in such a manner.
Many mysteries surround Ishi no Hoden. According to one story, two gods were sent here to build a stone palace. They were given only one day to do it. The local gods rebelled, and by the time the rebellion was suppressed, dawn had broken and the structure was unfinished. The two gods left, saying their spirits would reside within the massive rock and protect the land for eternity.
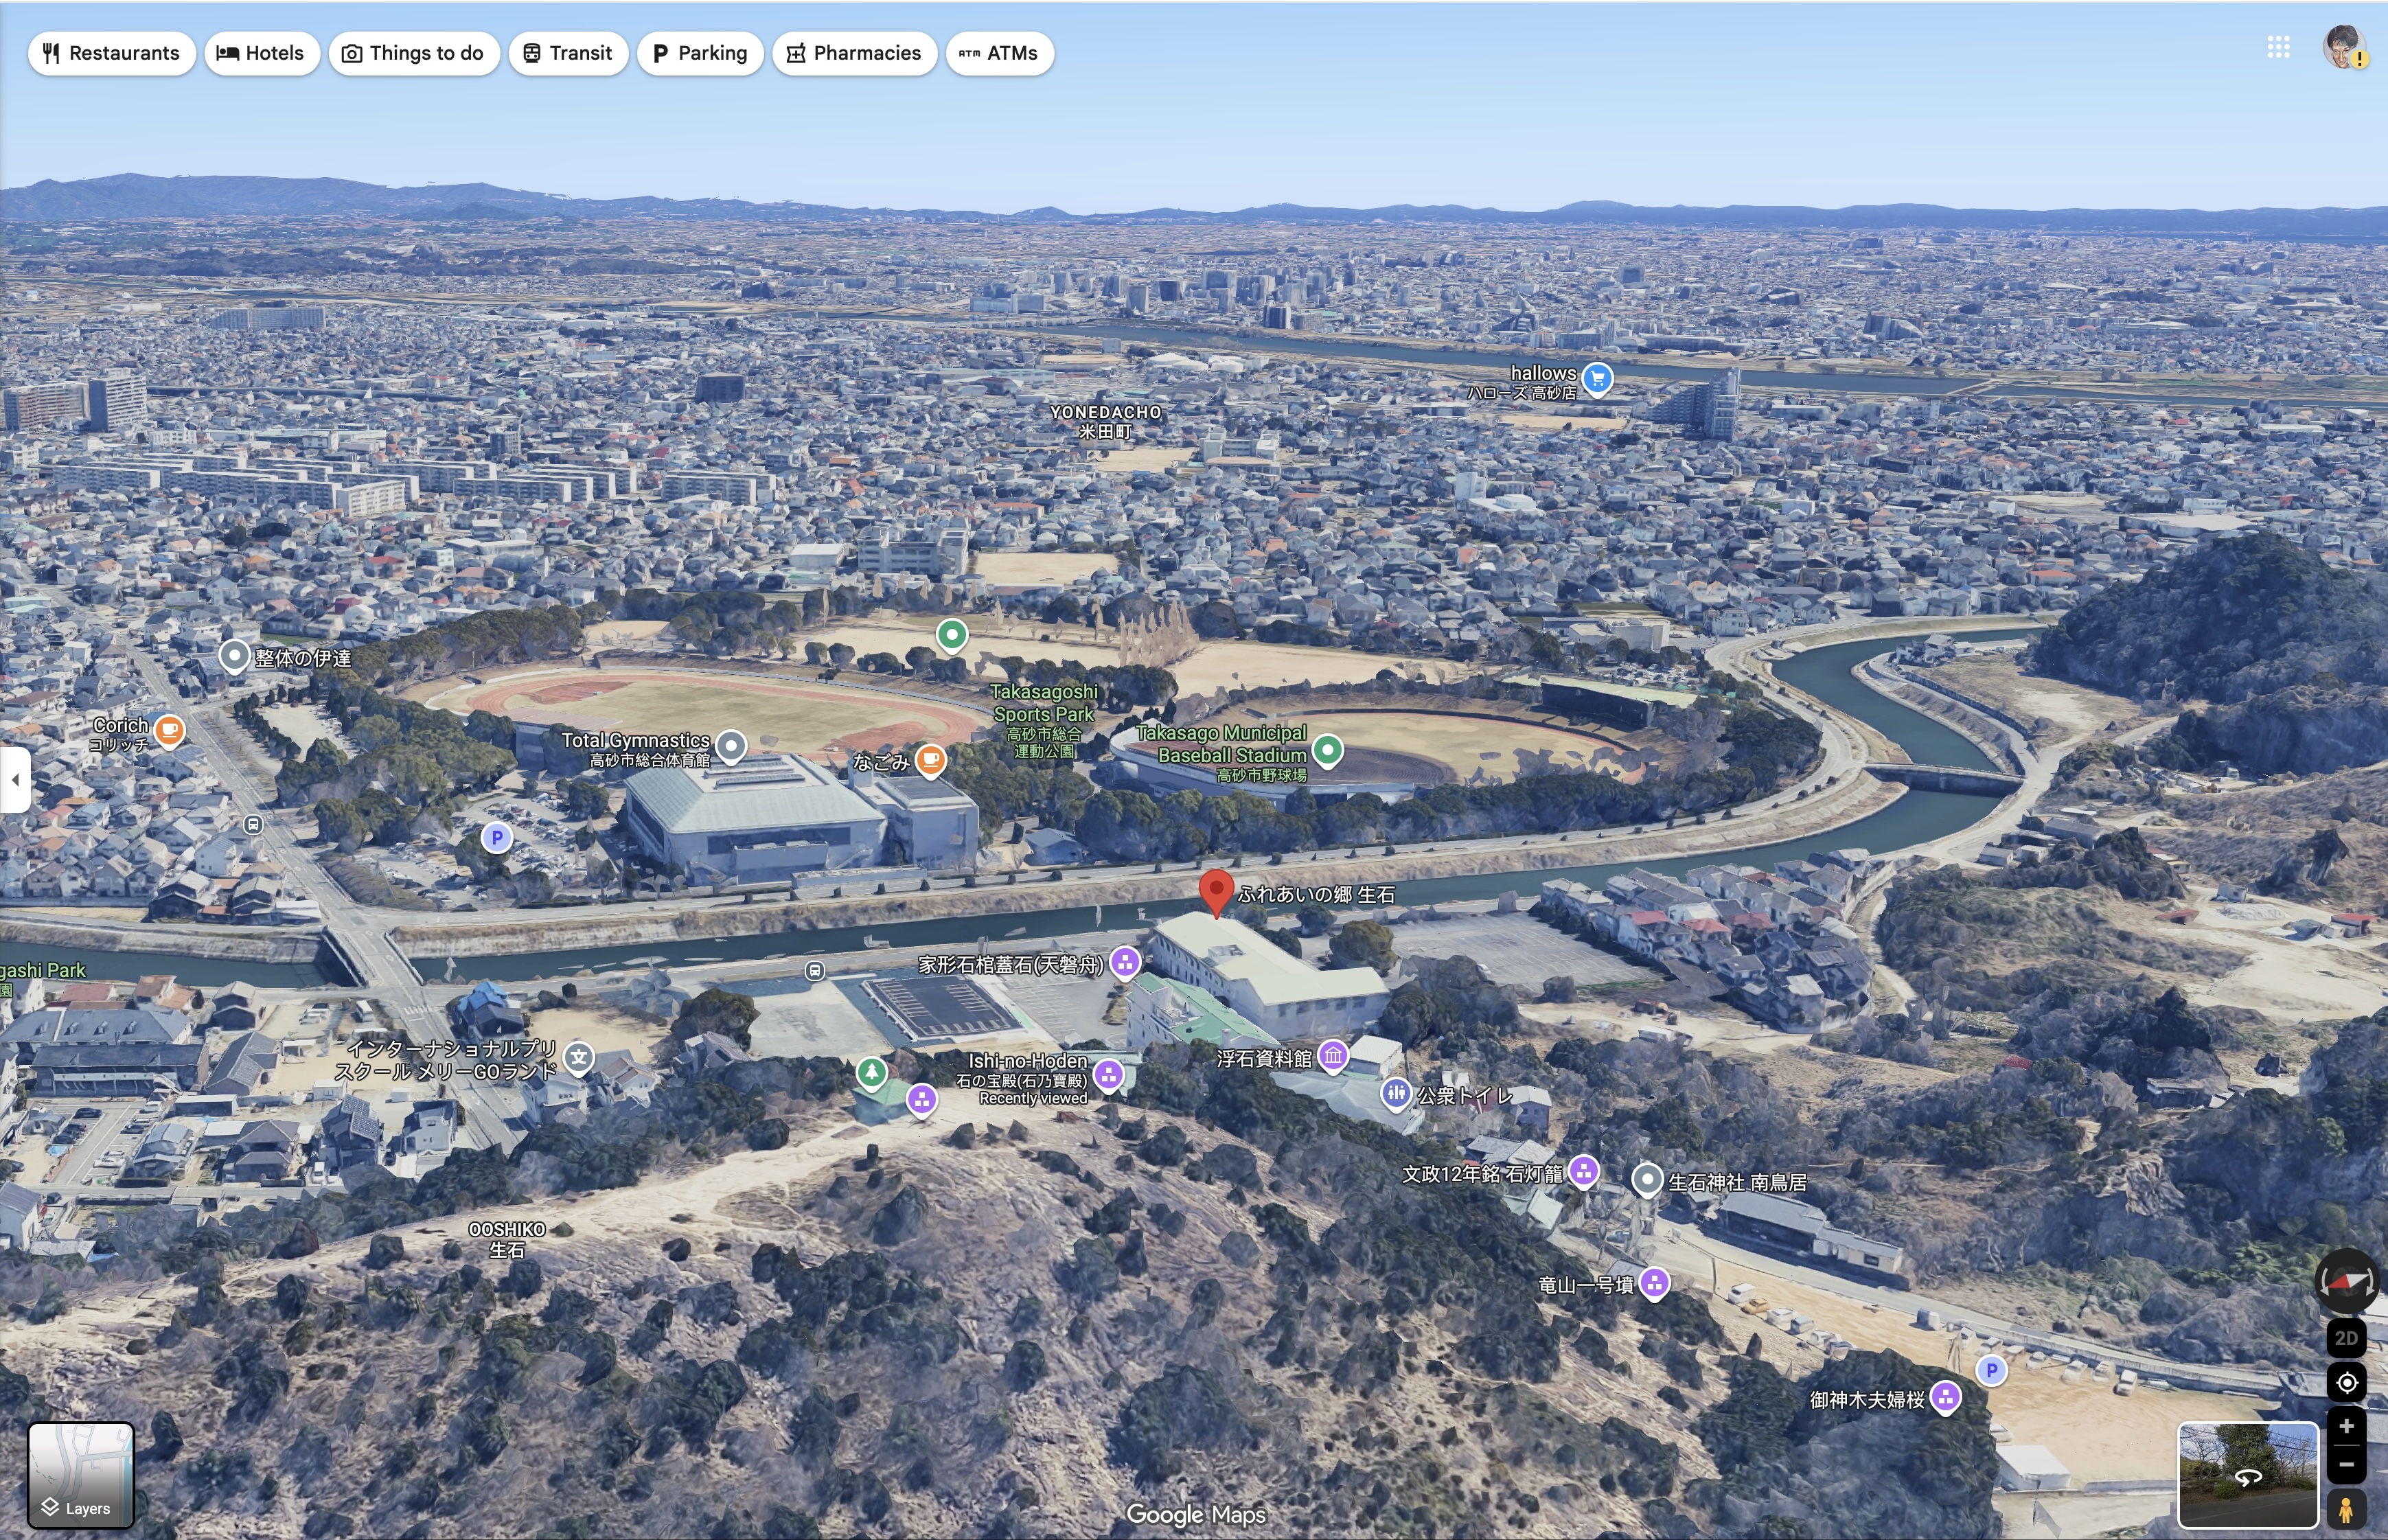
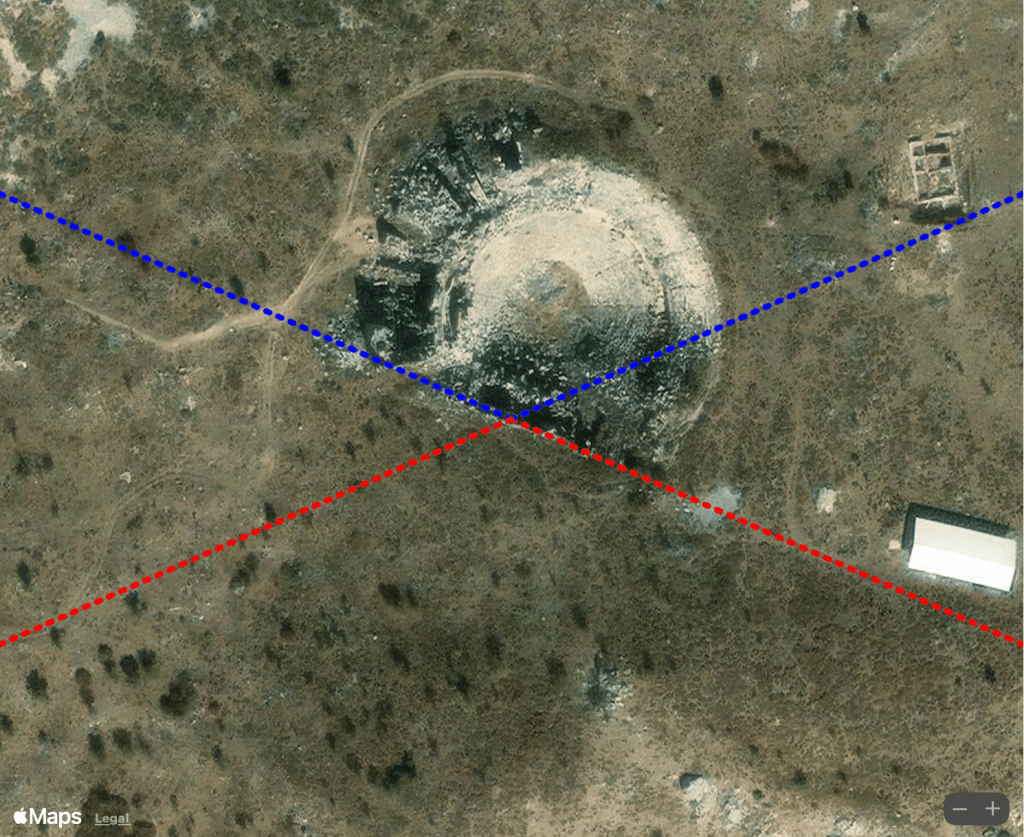
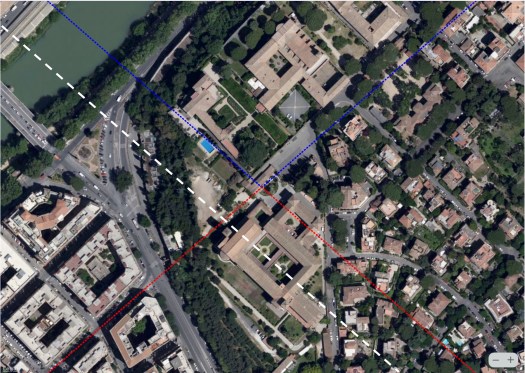
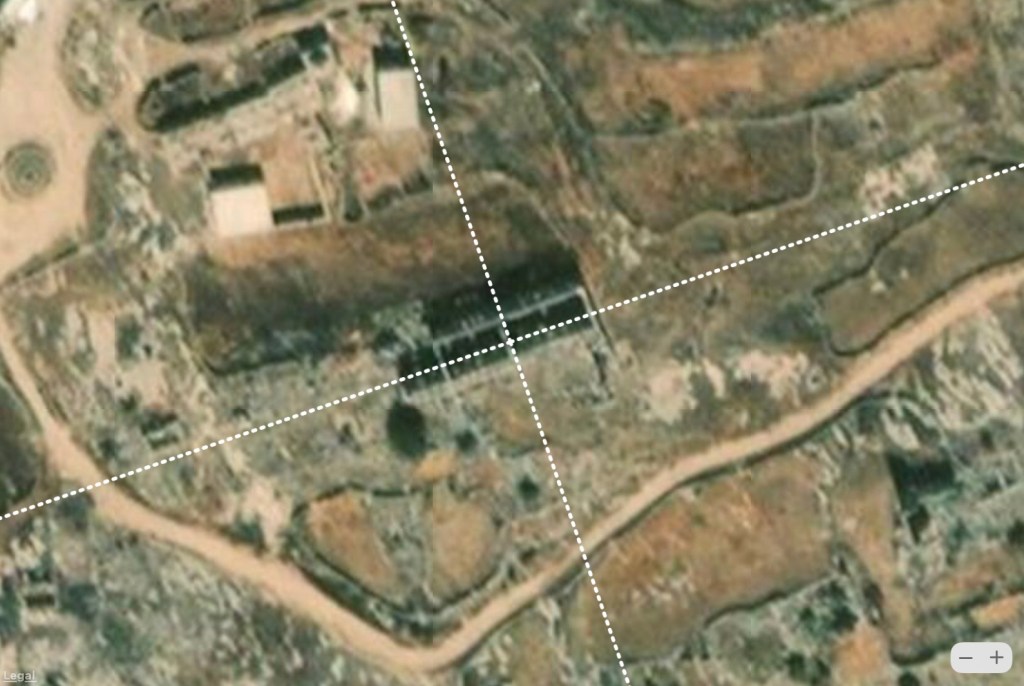
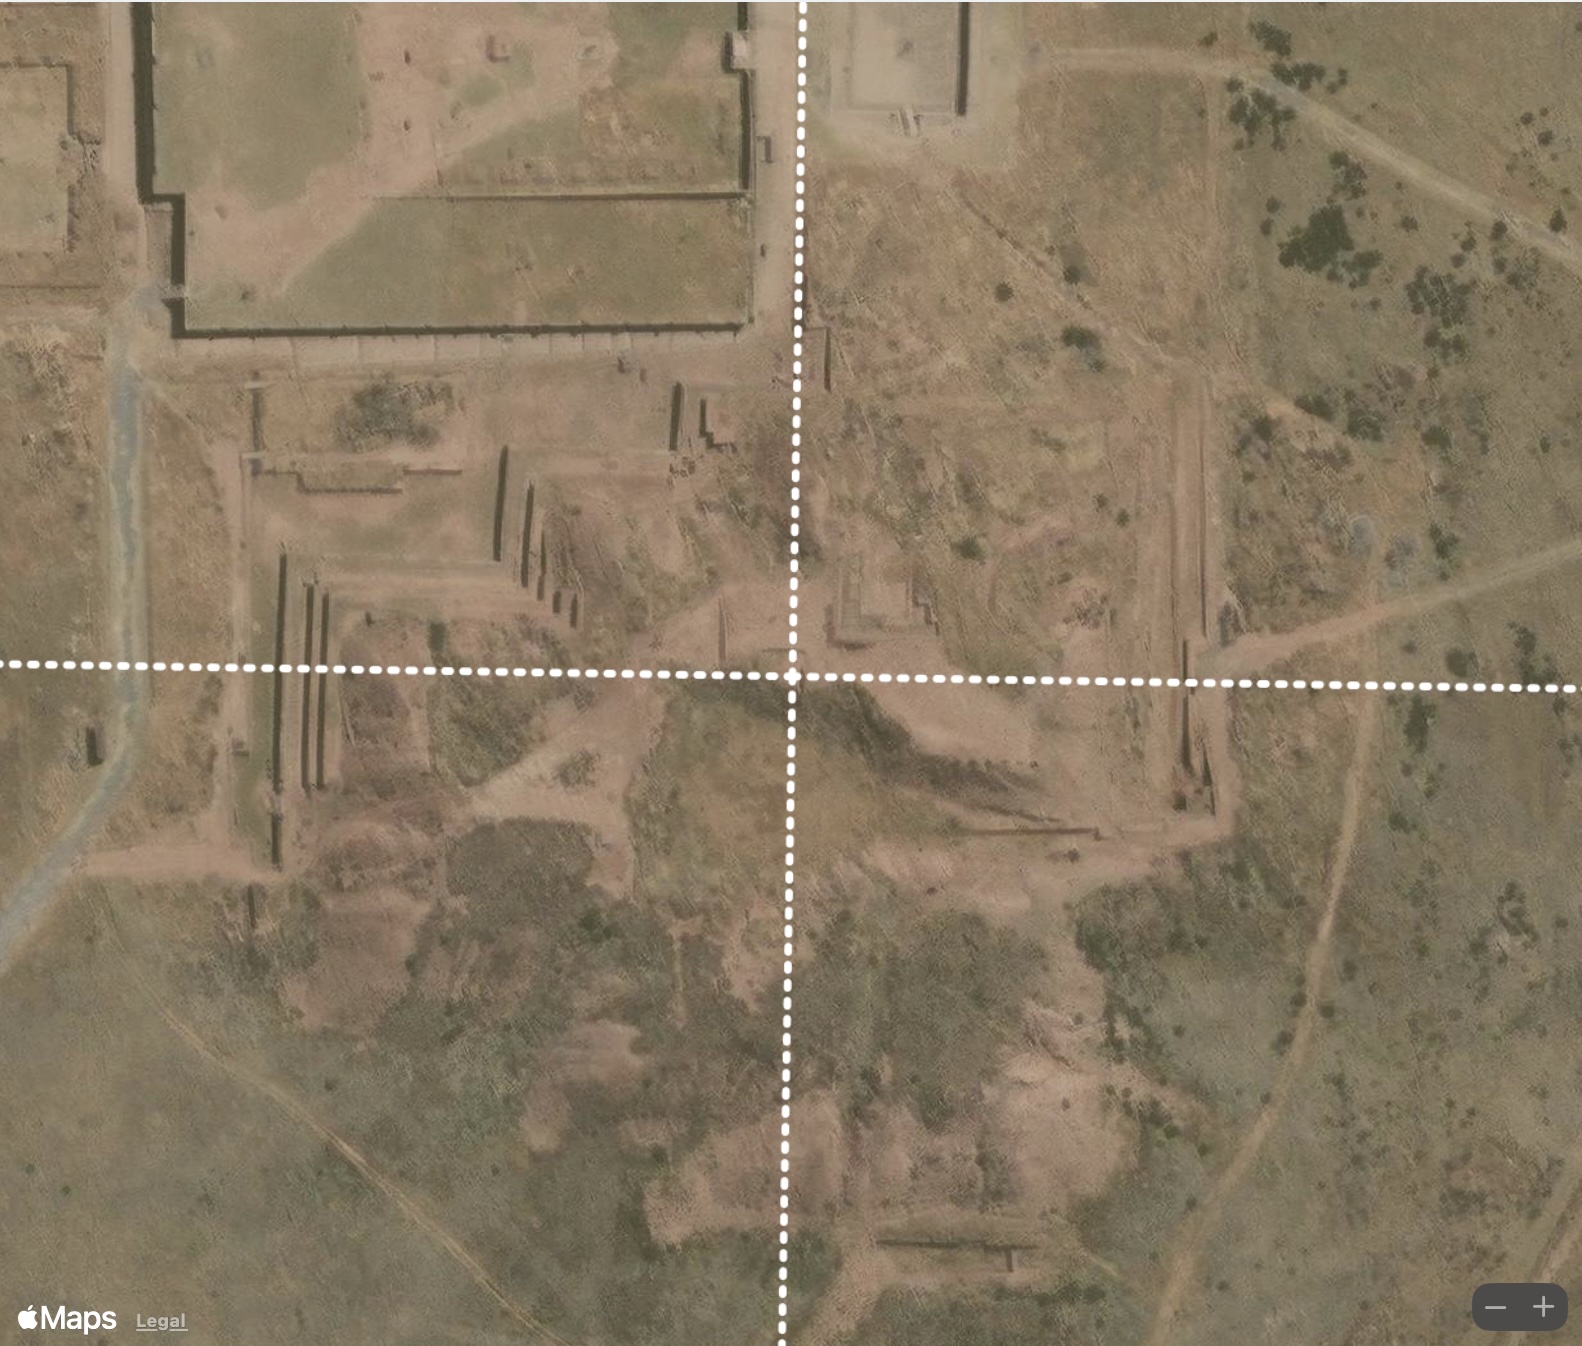
Google Map views of Ishi no Hoden from the northeast (left) and southwest (right).
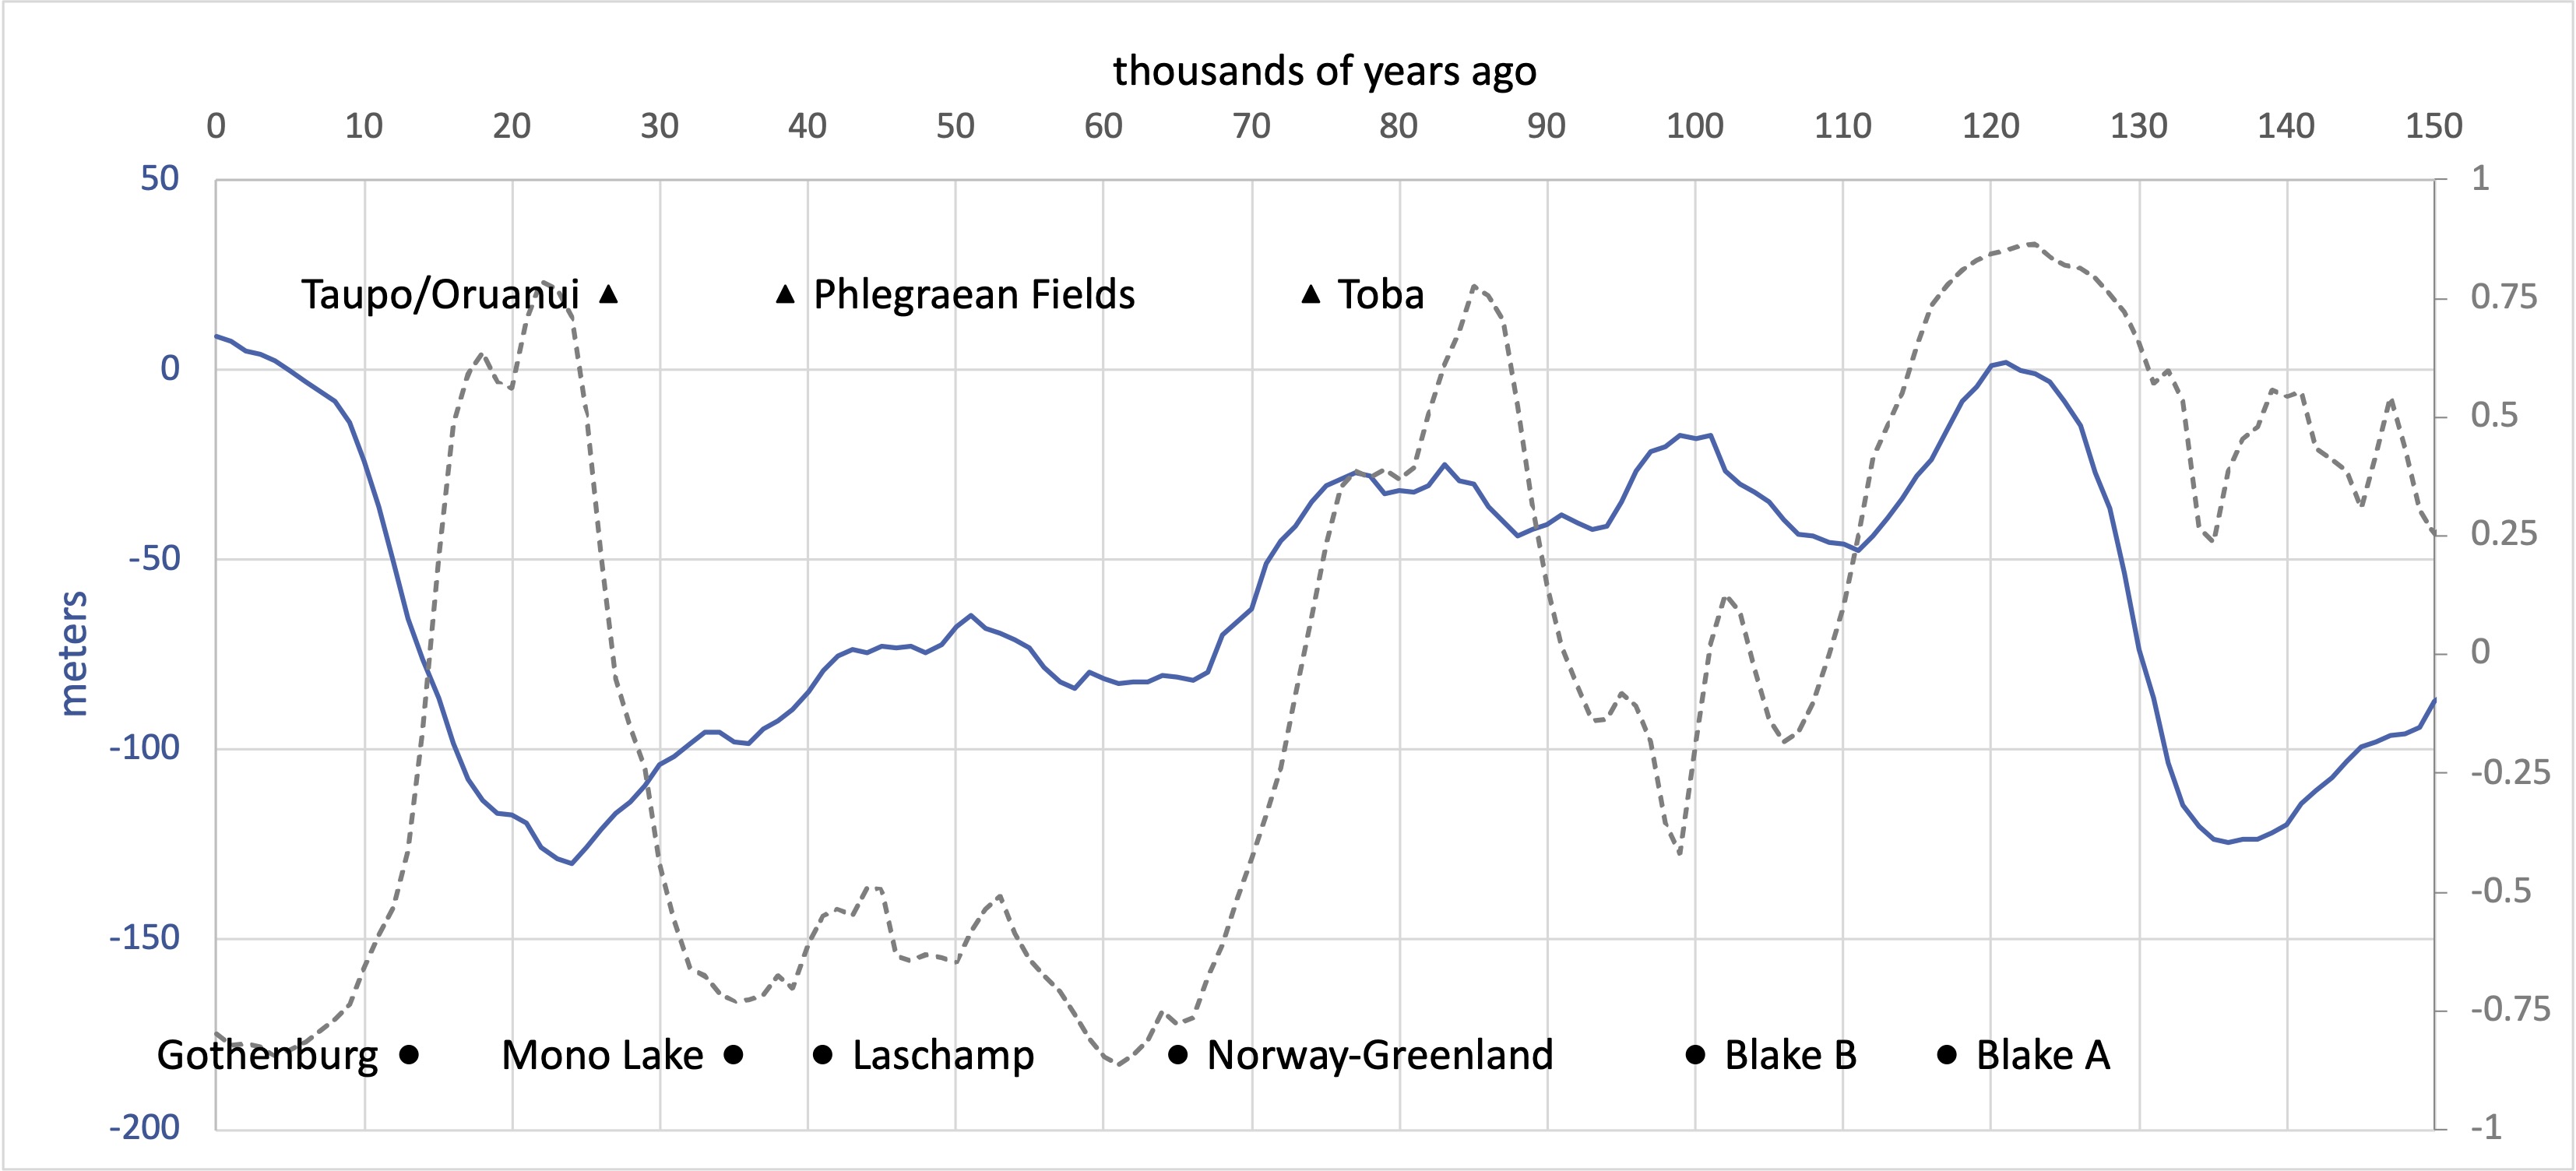
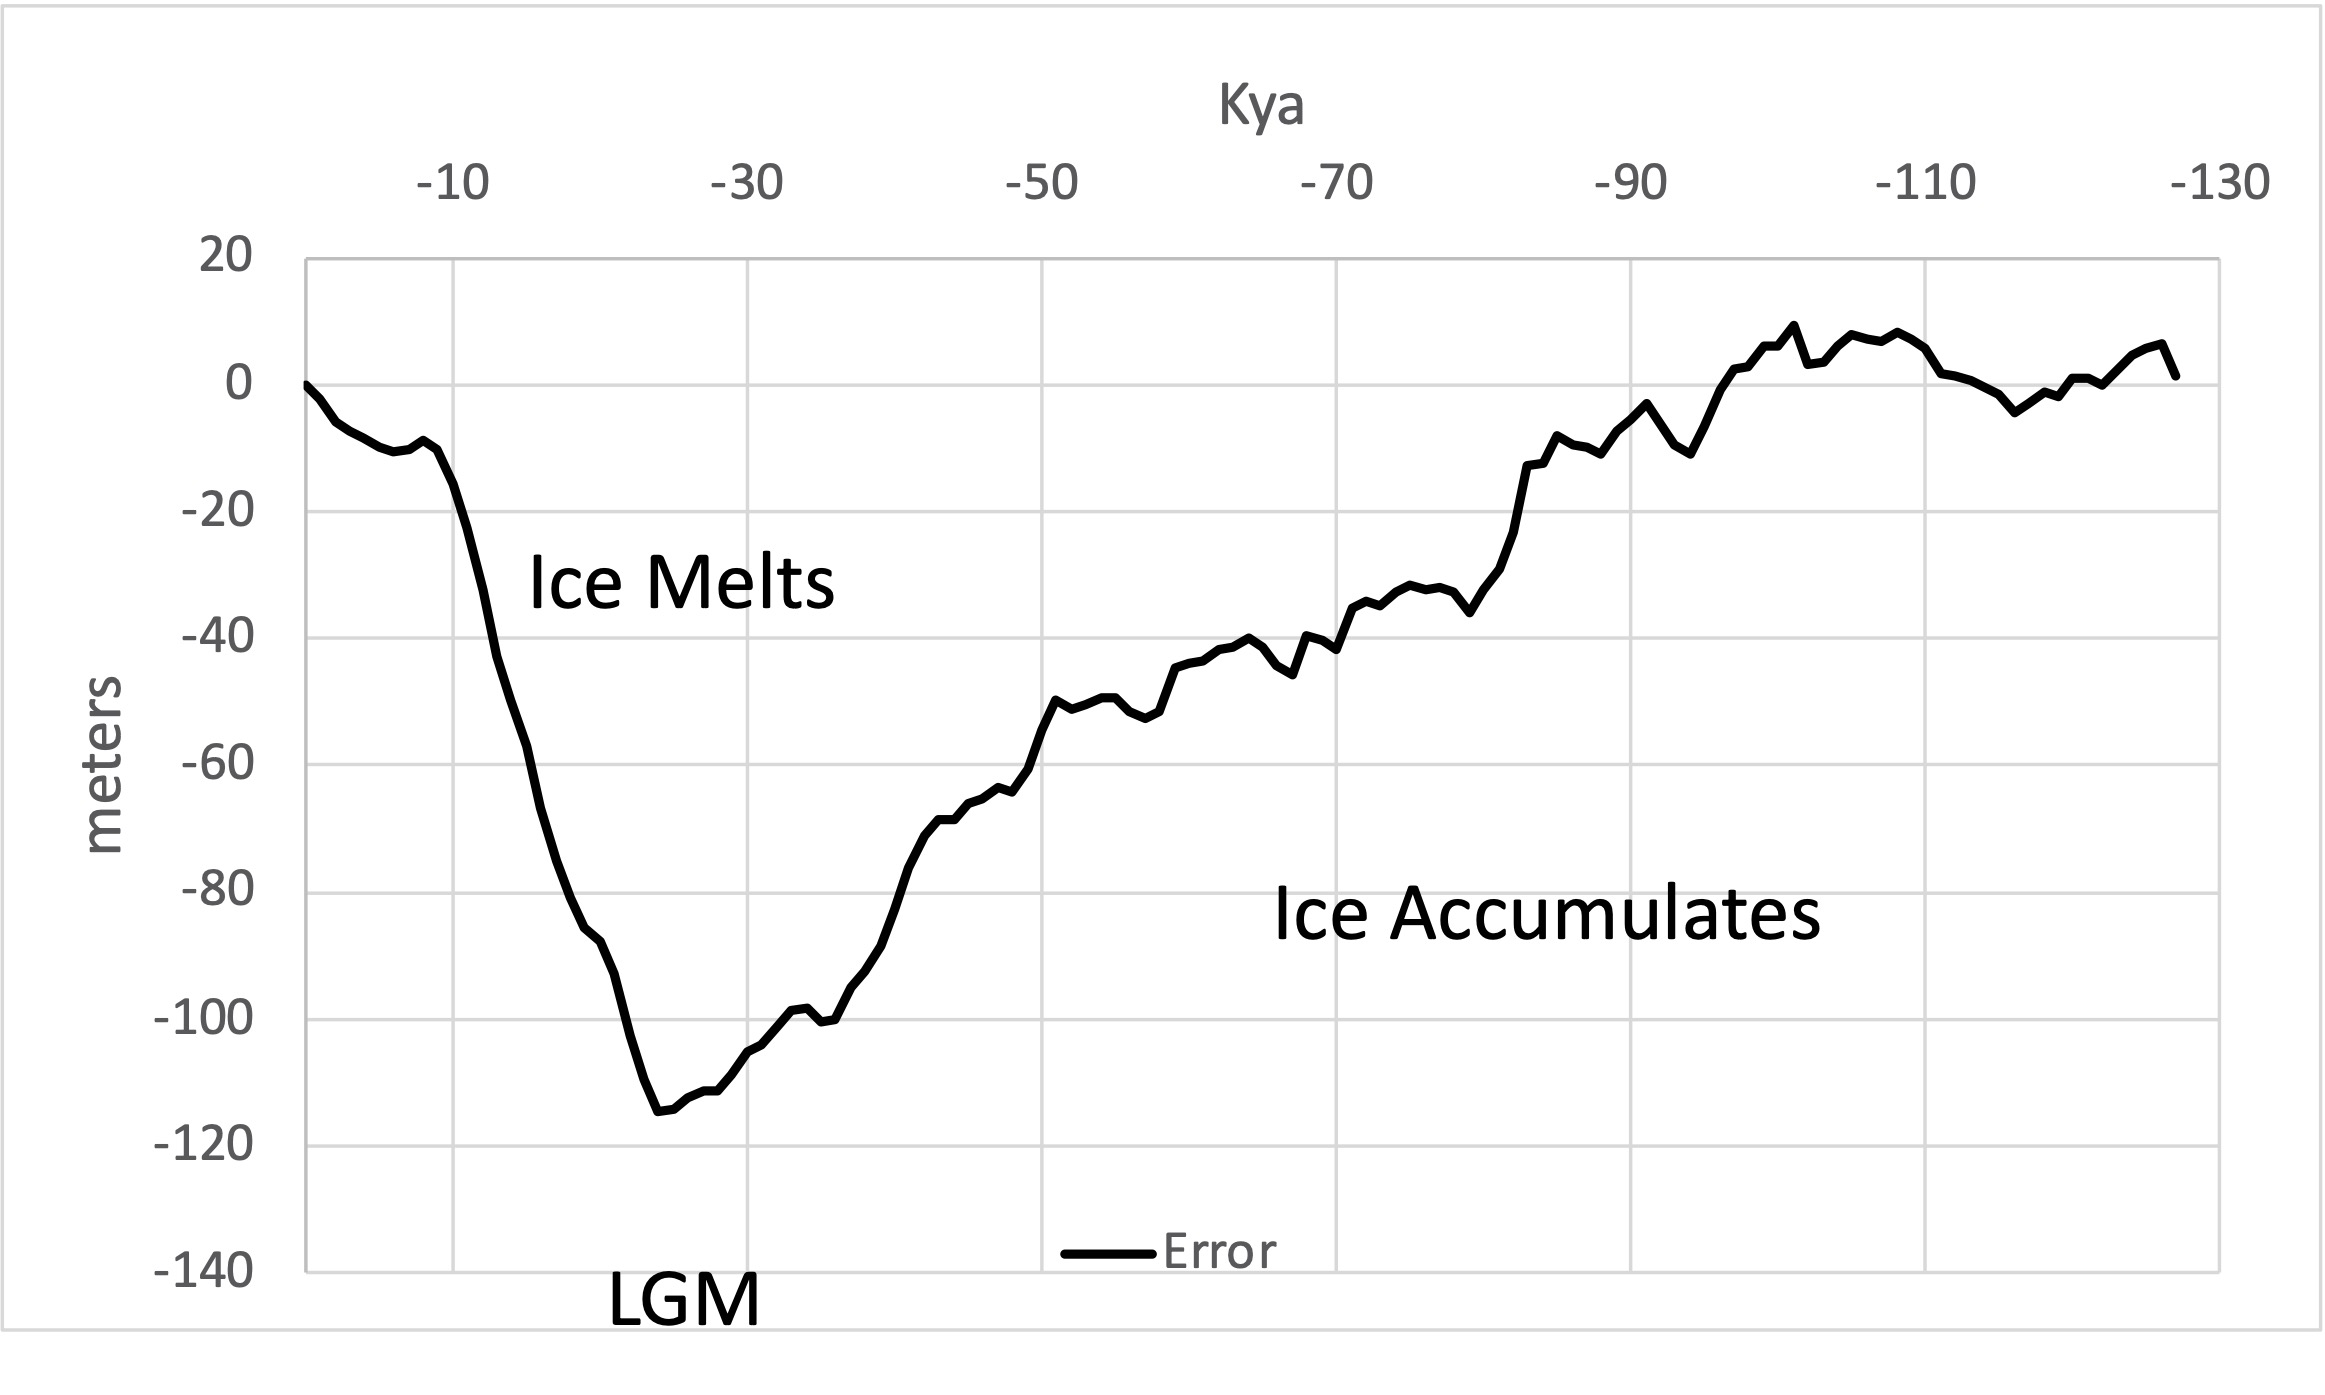
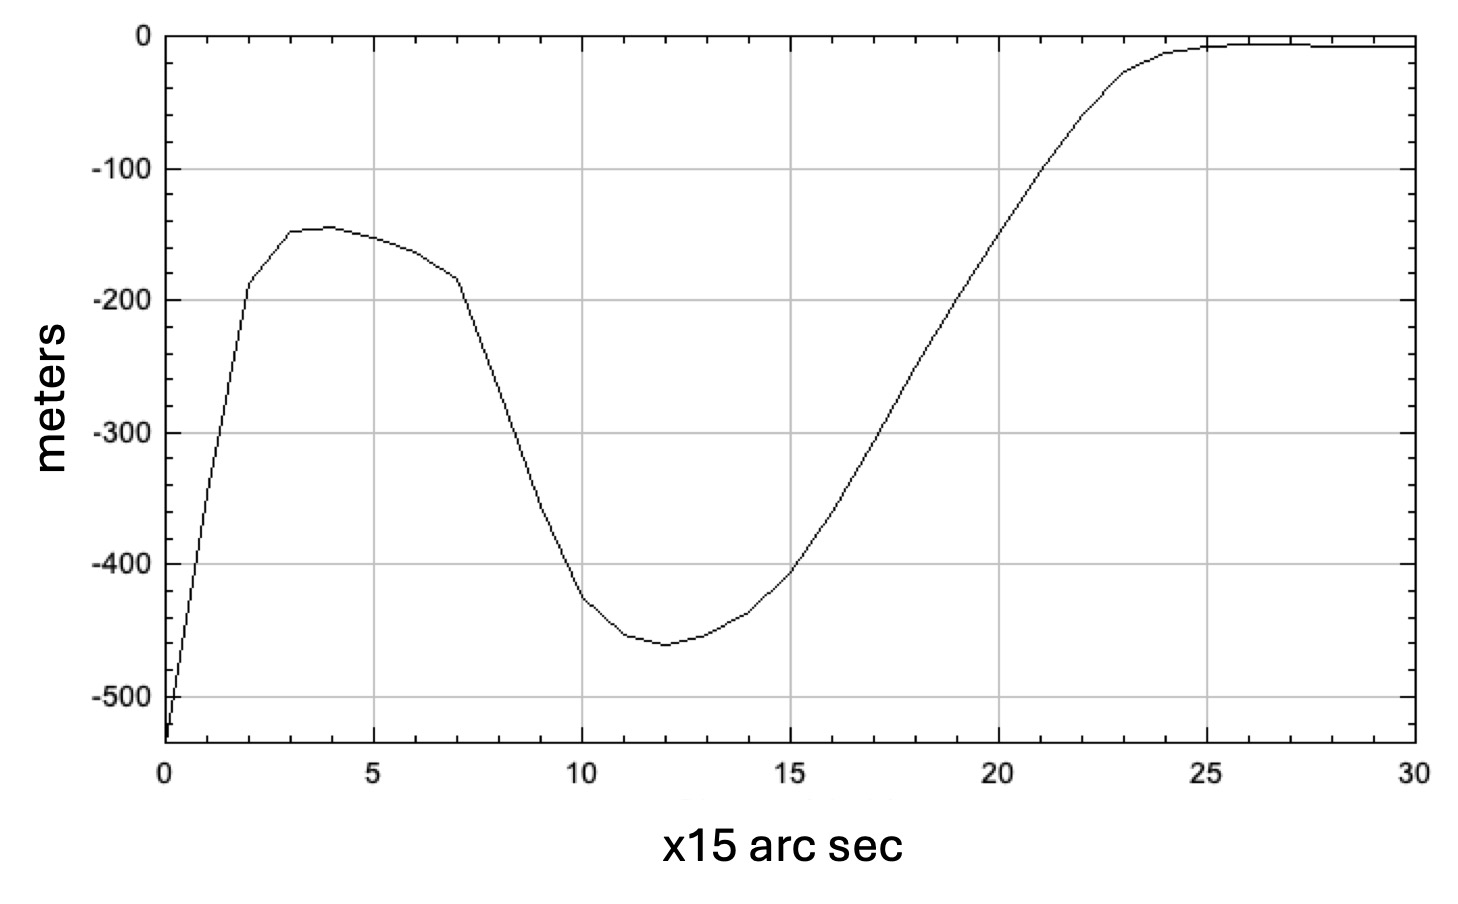
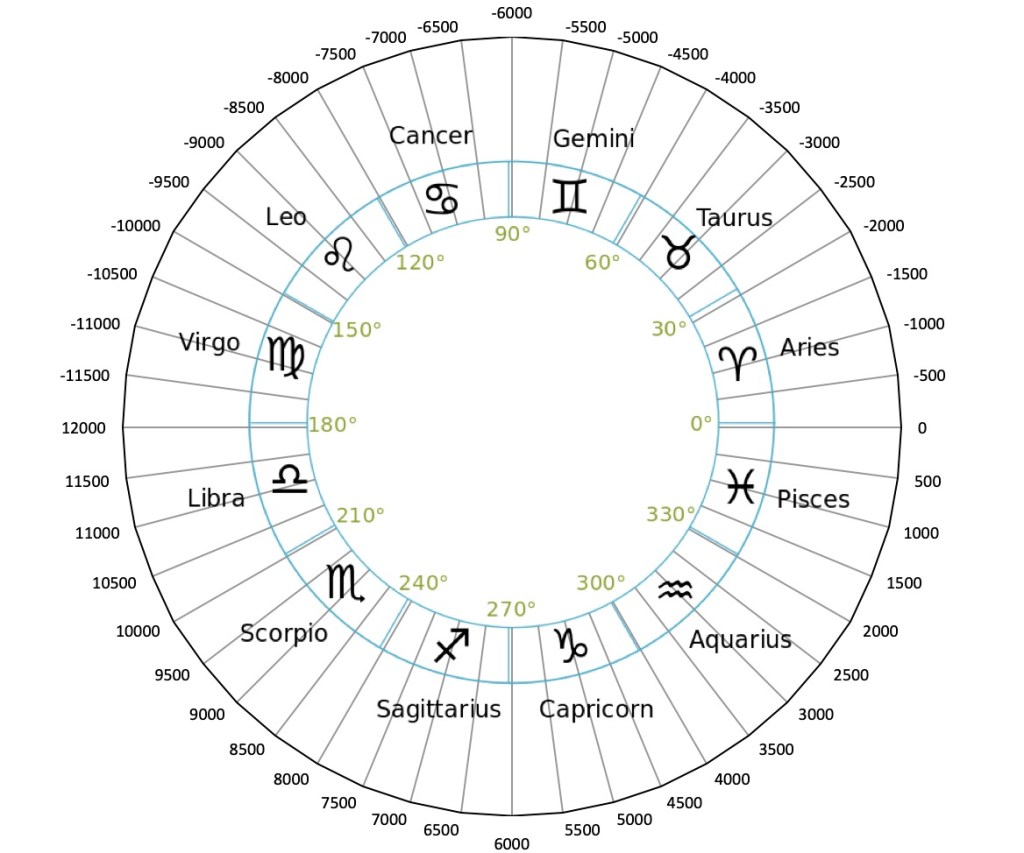
According to legend, the Oshiko Jinja Shinto shrine was founded in 97 CE during Emperor Keiko’s reign with “divine instruction” to worship the giant floating rock. If this is true, then Ishi no Hoden existed before the Kofun period. This is consistent with its alignment as the structure becomes more closely lined up with minor lunar standstills as you go back in time. Changes in Earth’s obliquity or axial tilt cause the direction of solstices and lunar standstills to change by several degrees over a 41,000-year cycle. The best alignment with minor lunar standstills would have occurred approximately 25,000 BCE. As shown above, its placement near the top of a hill would have provided an excellent view of the Moon rising in the southeast sky at a minor lunar standstill.
Masuda no Iwafume
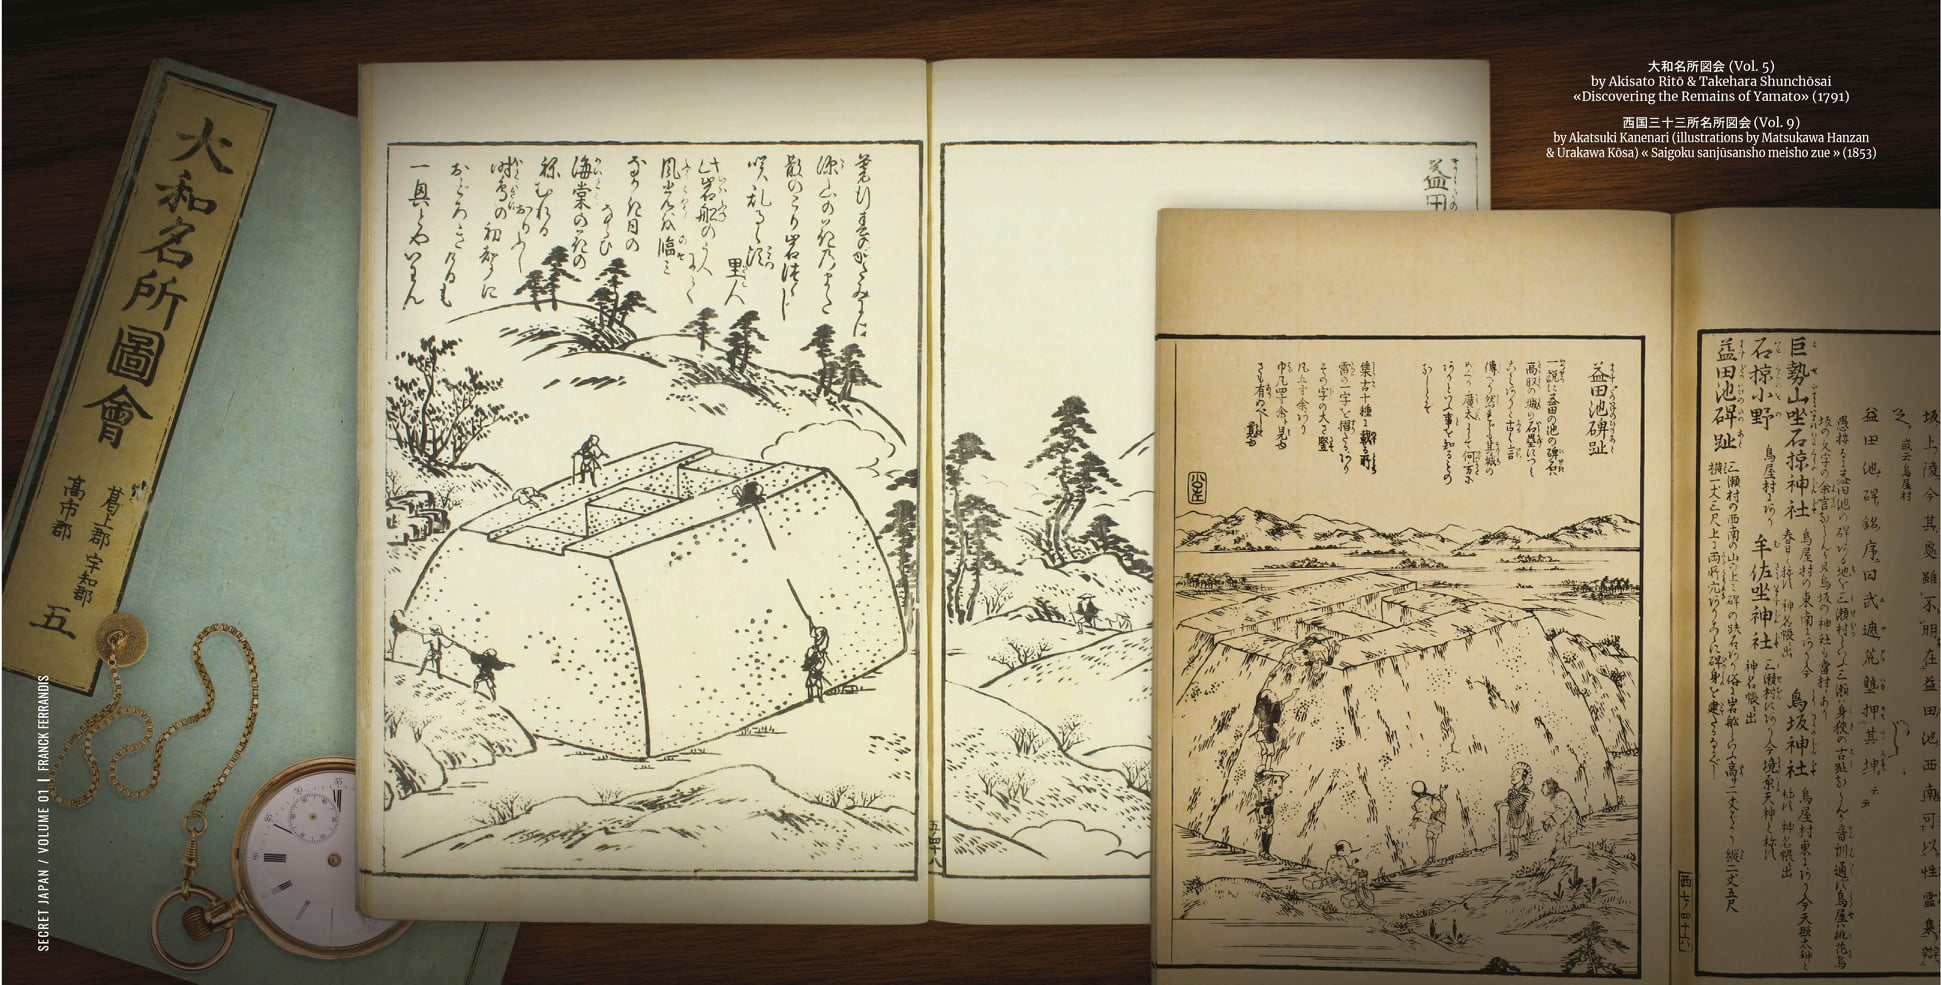
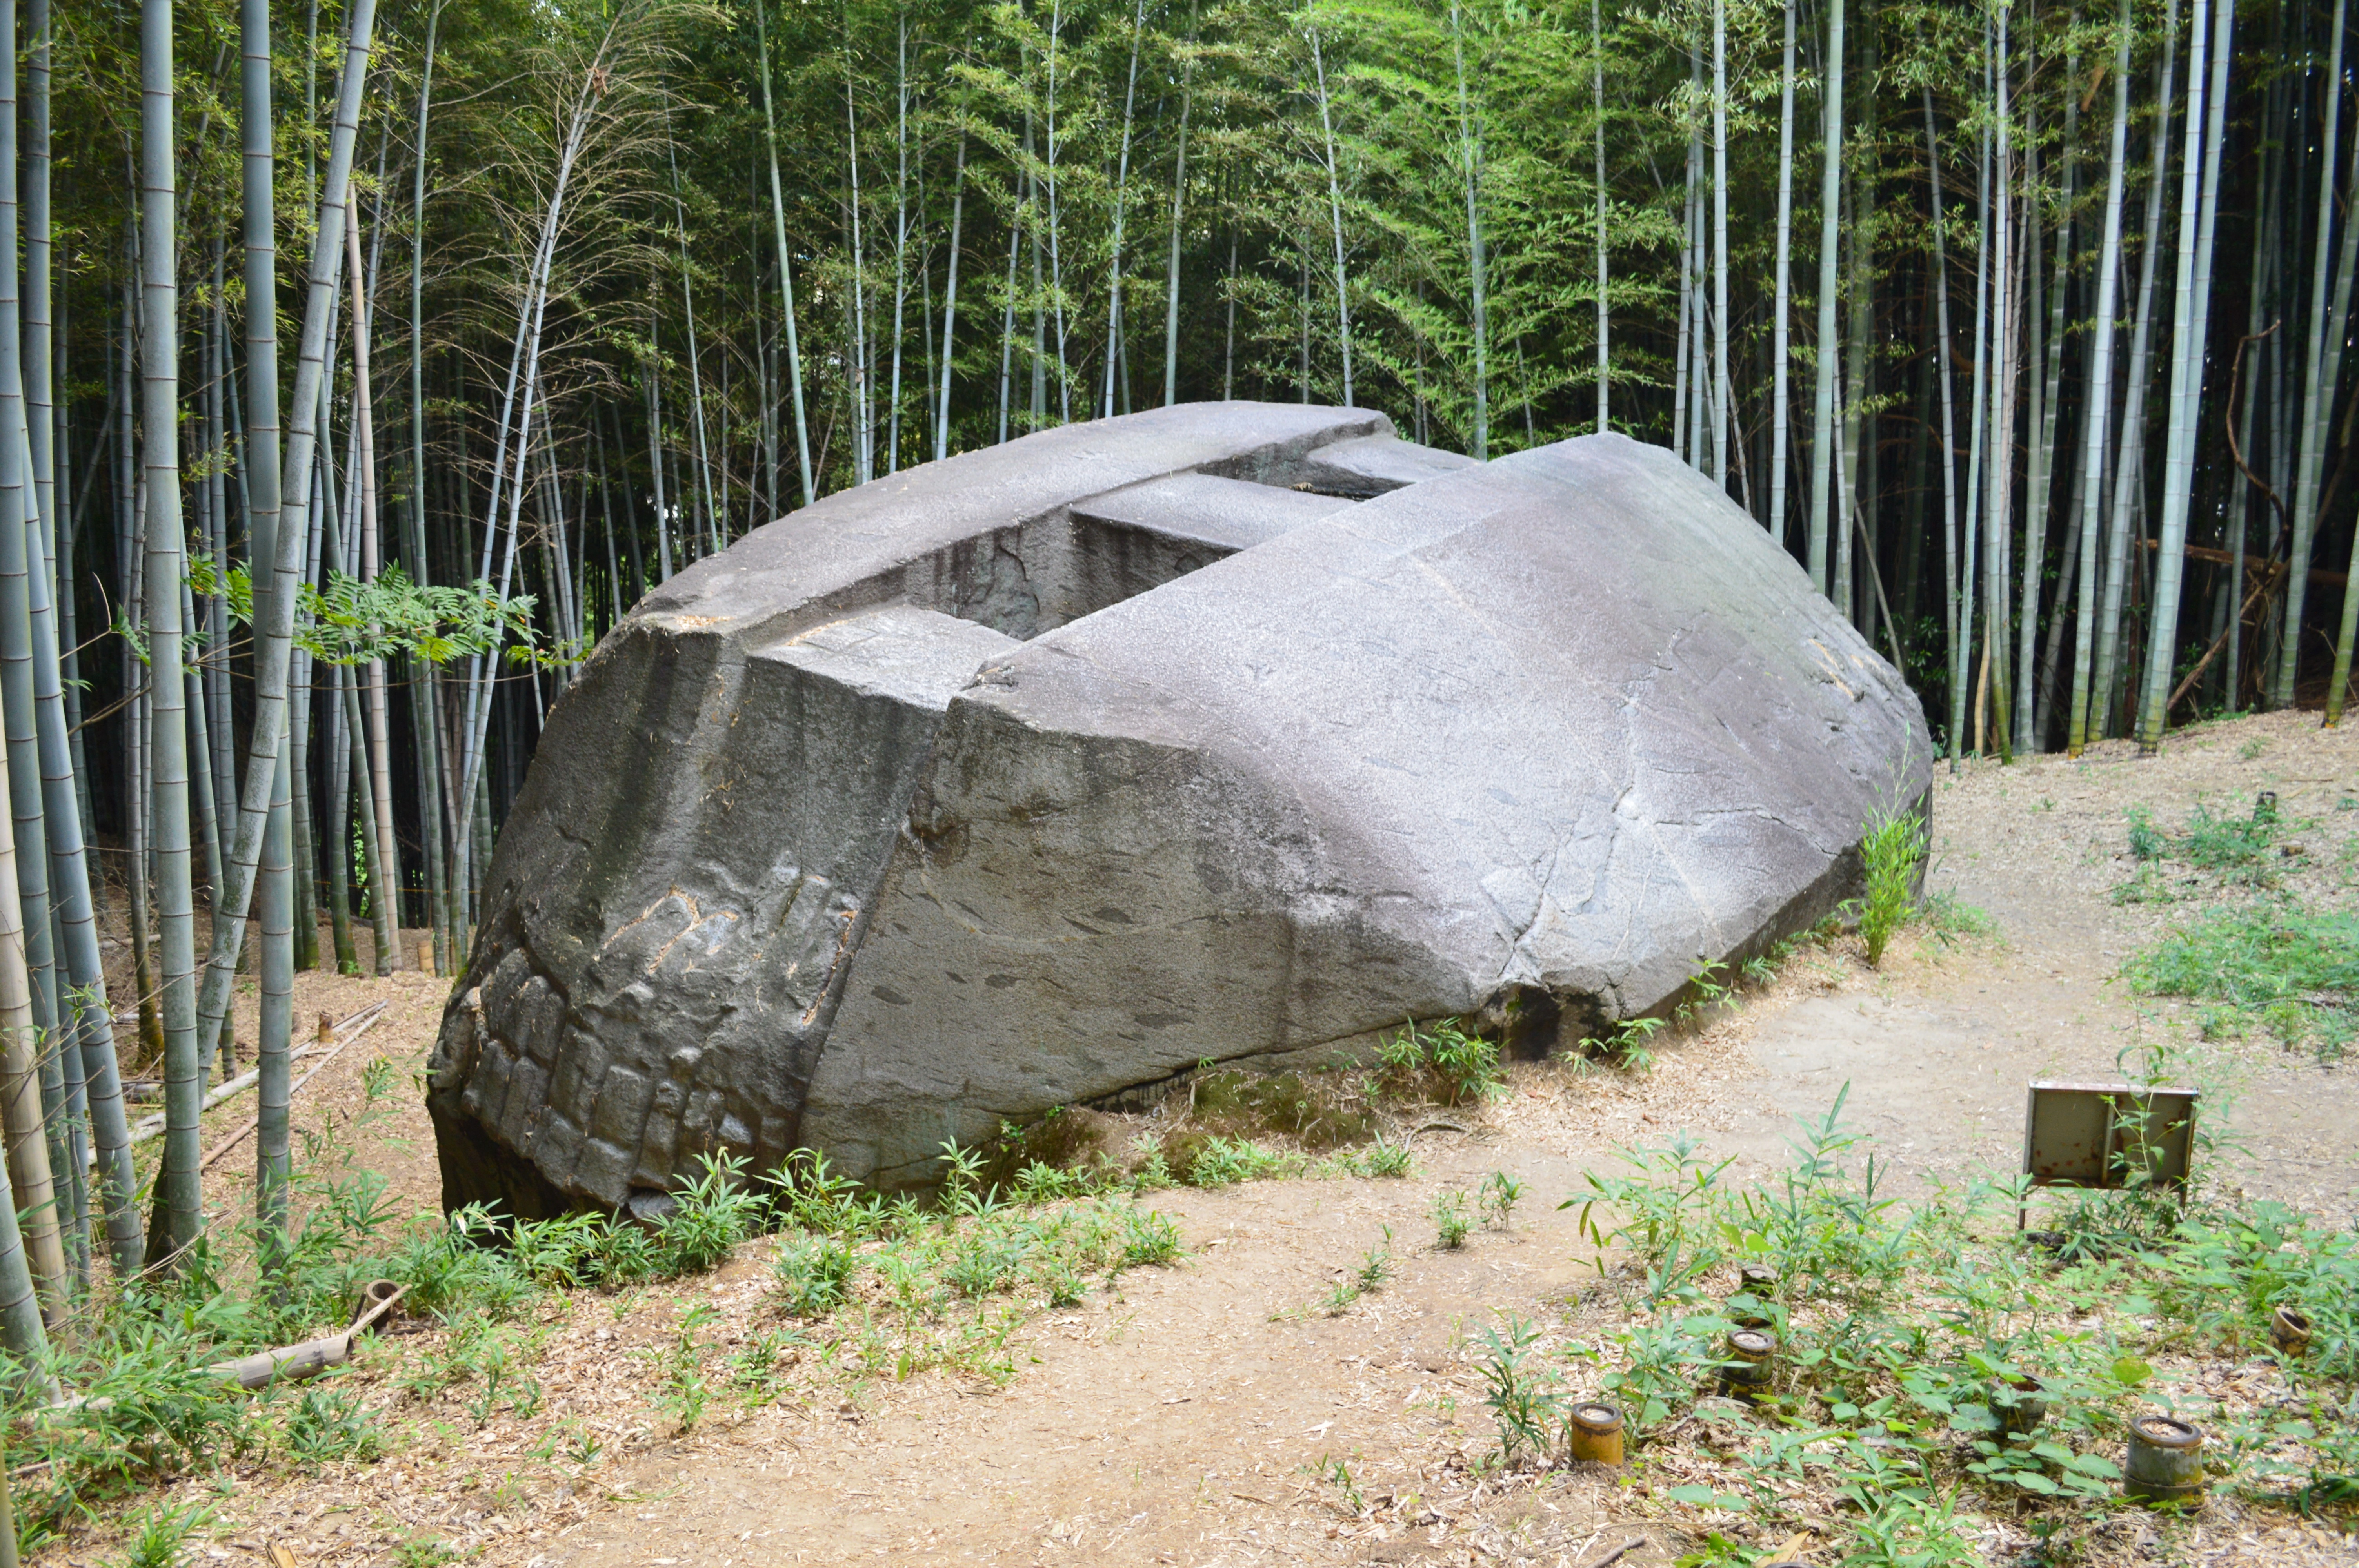
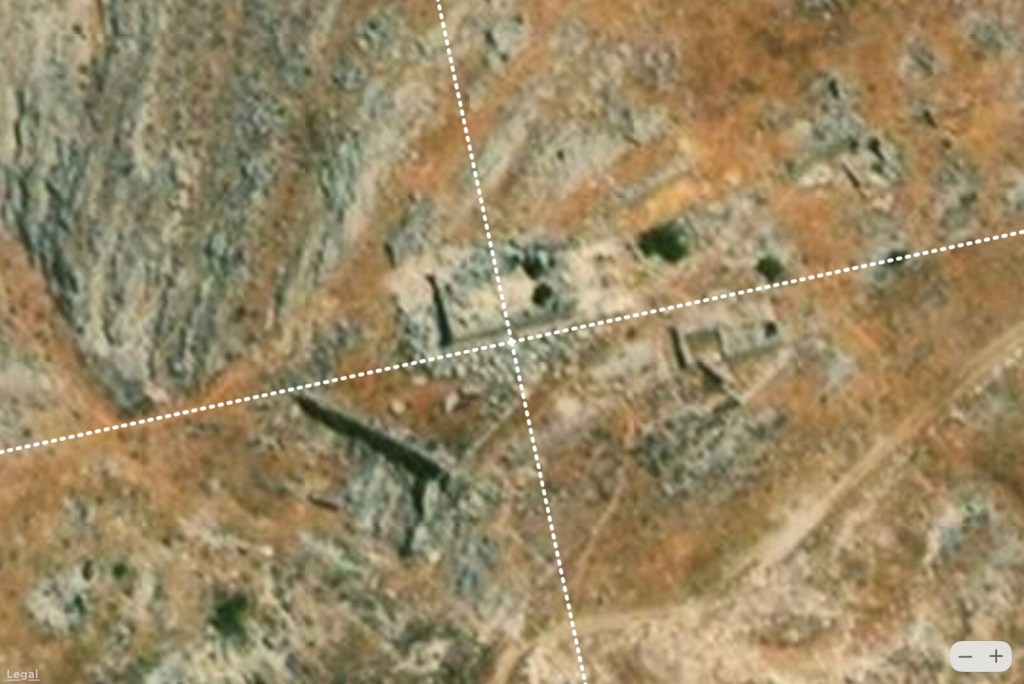
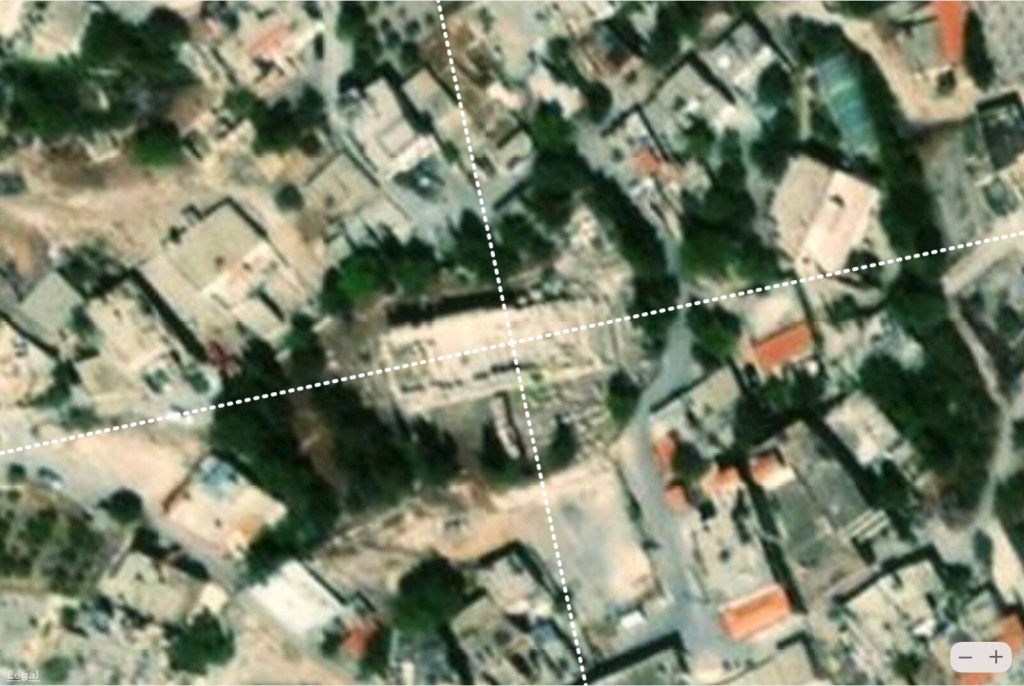
Masuda no Iwafune (“Rock Ship of Masuda”) is the largest megalith in Japan, weighing an estimated 800 to 1,000 tons. Like Ishi no Hoden, it was cut from the native bedrock, not cut and transported like the large megalith found in Osaka Castle. Masuda no Iwafune first appears in the Yamato Meisho Zue – a famous Edo-period Japanese woodblock-printed guidebook from 1791, focusing on the historic Yamato Province (modern-day Nara area), featuring detailed text and illustrations of famous places, temples, and shrines.
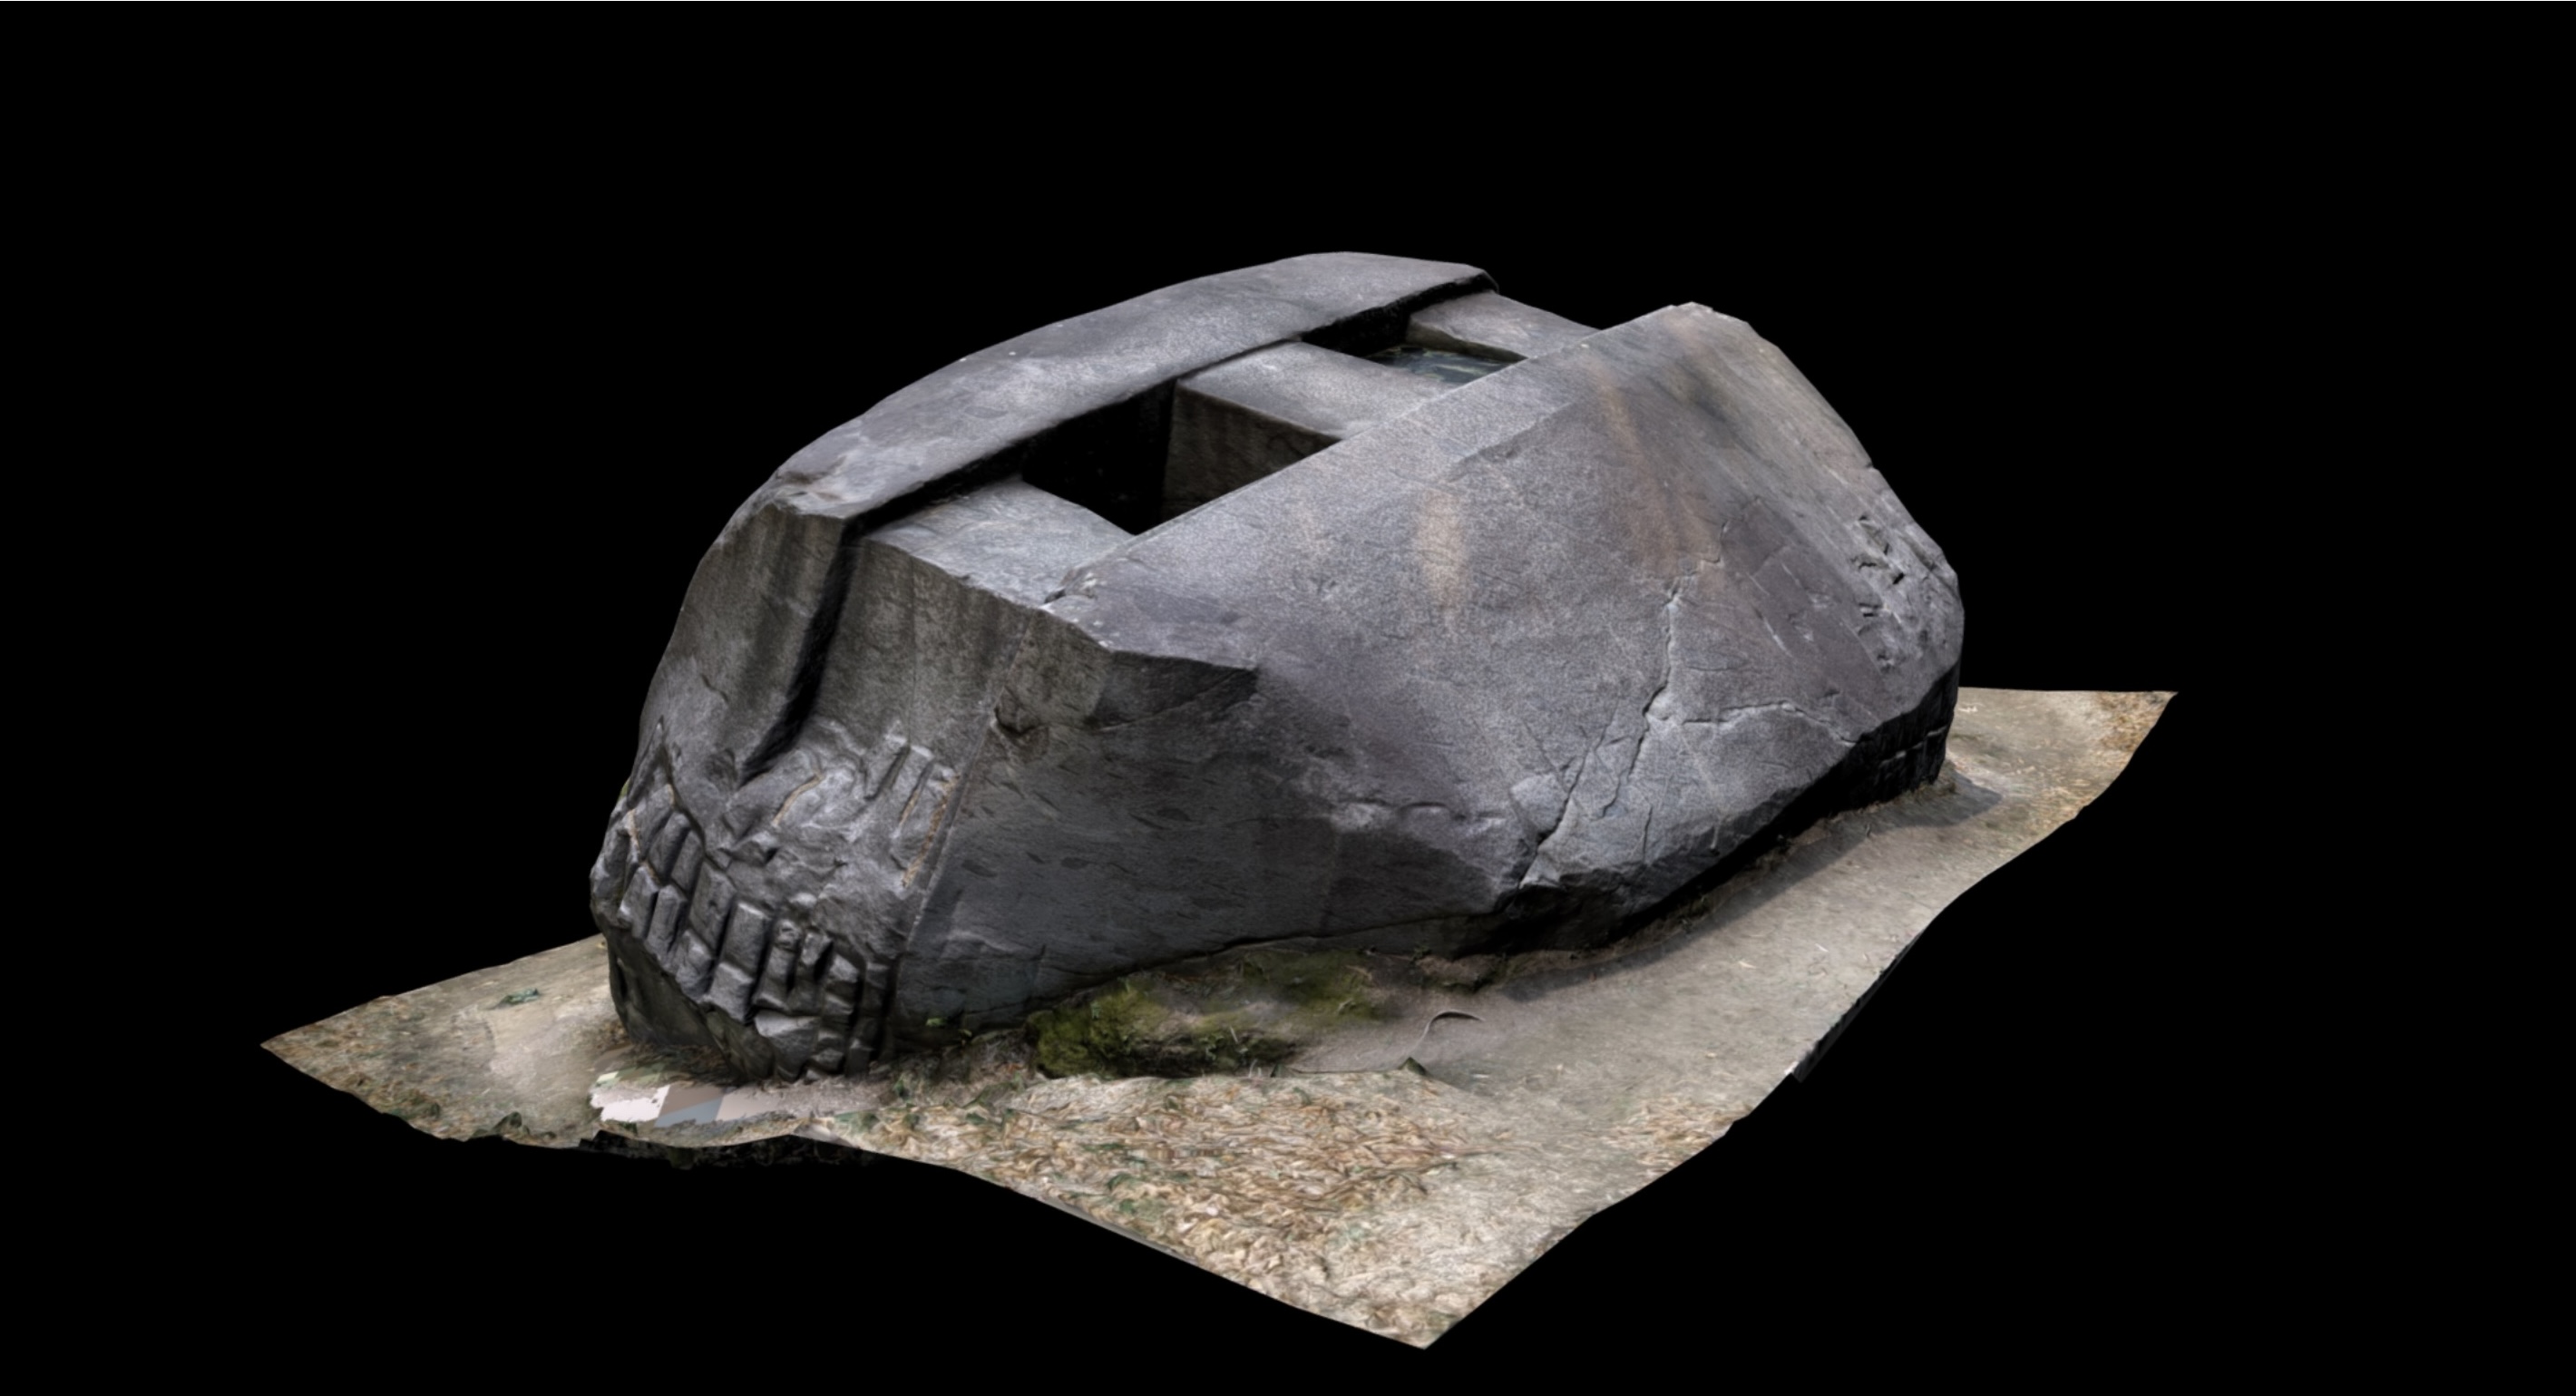
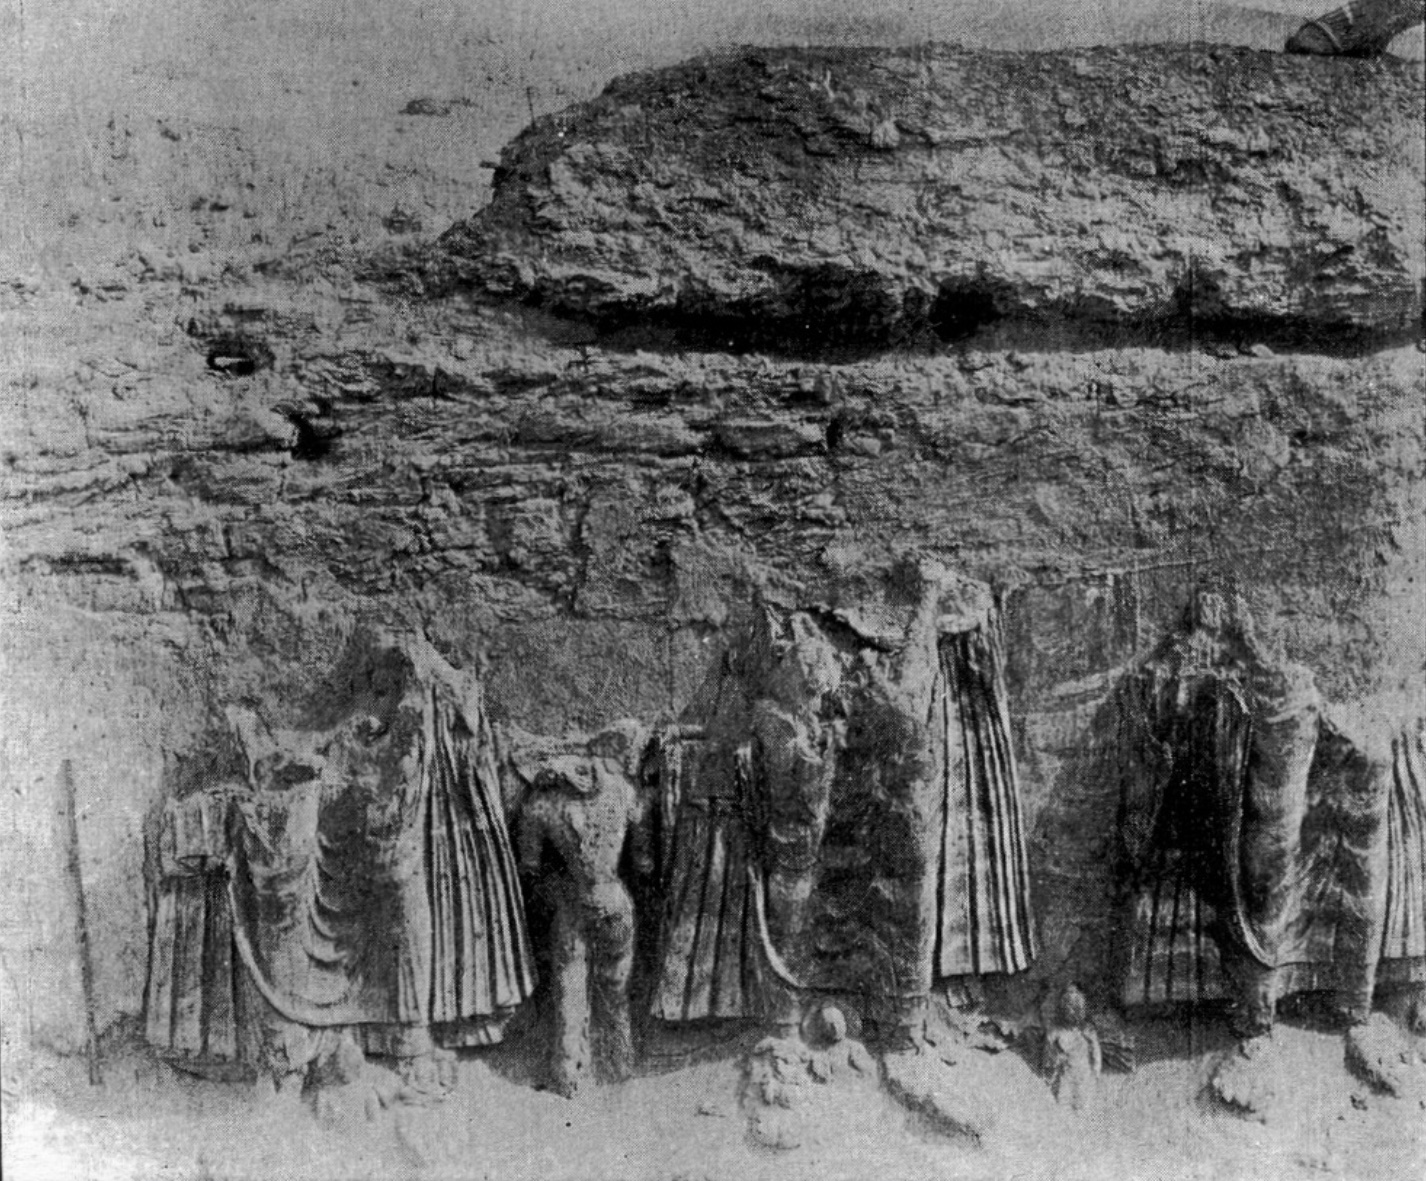
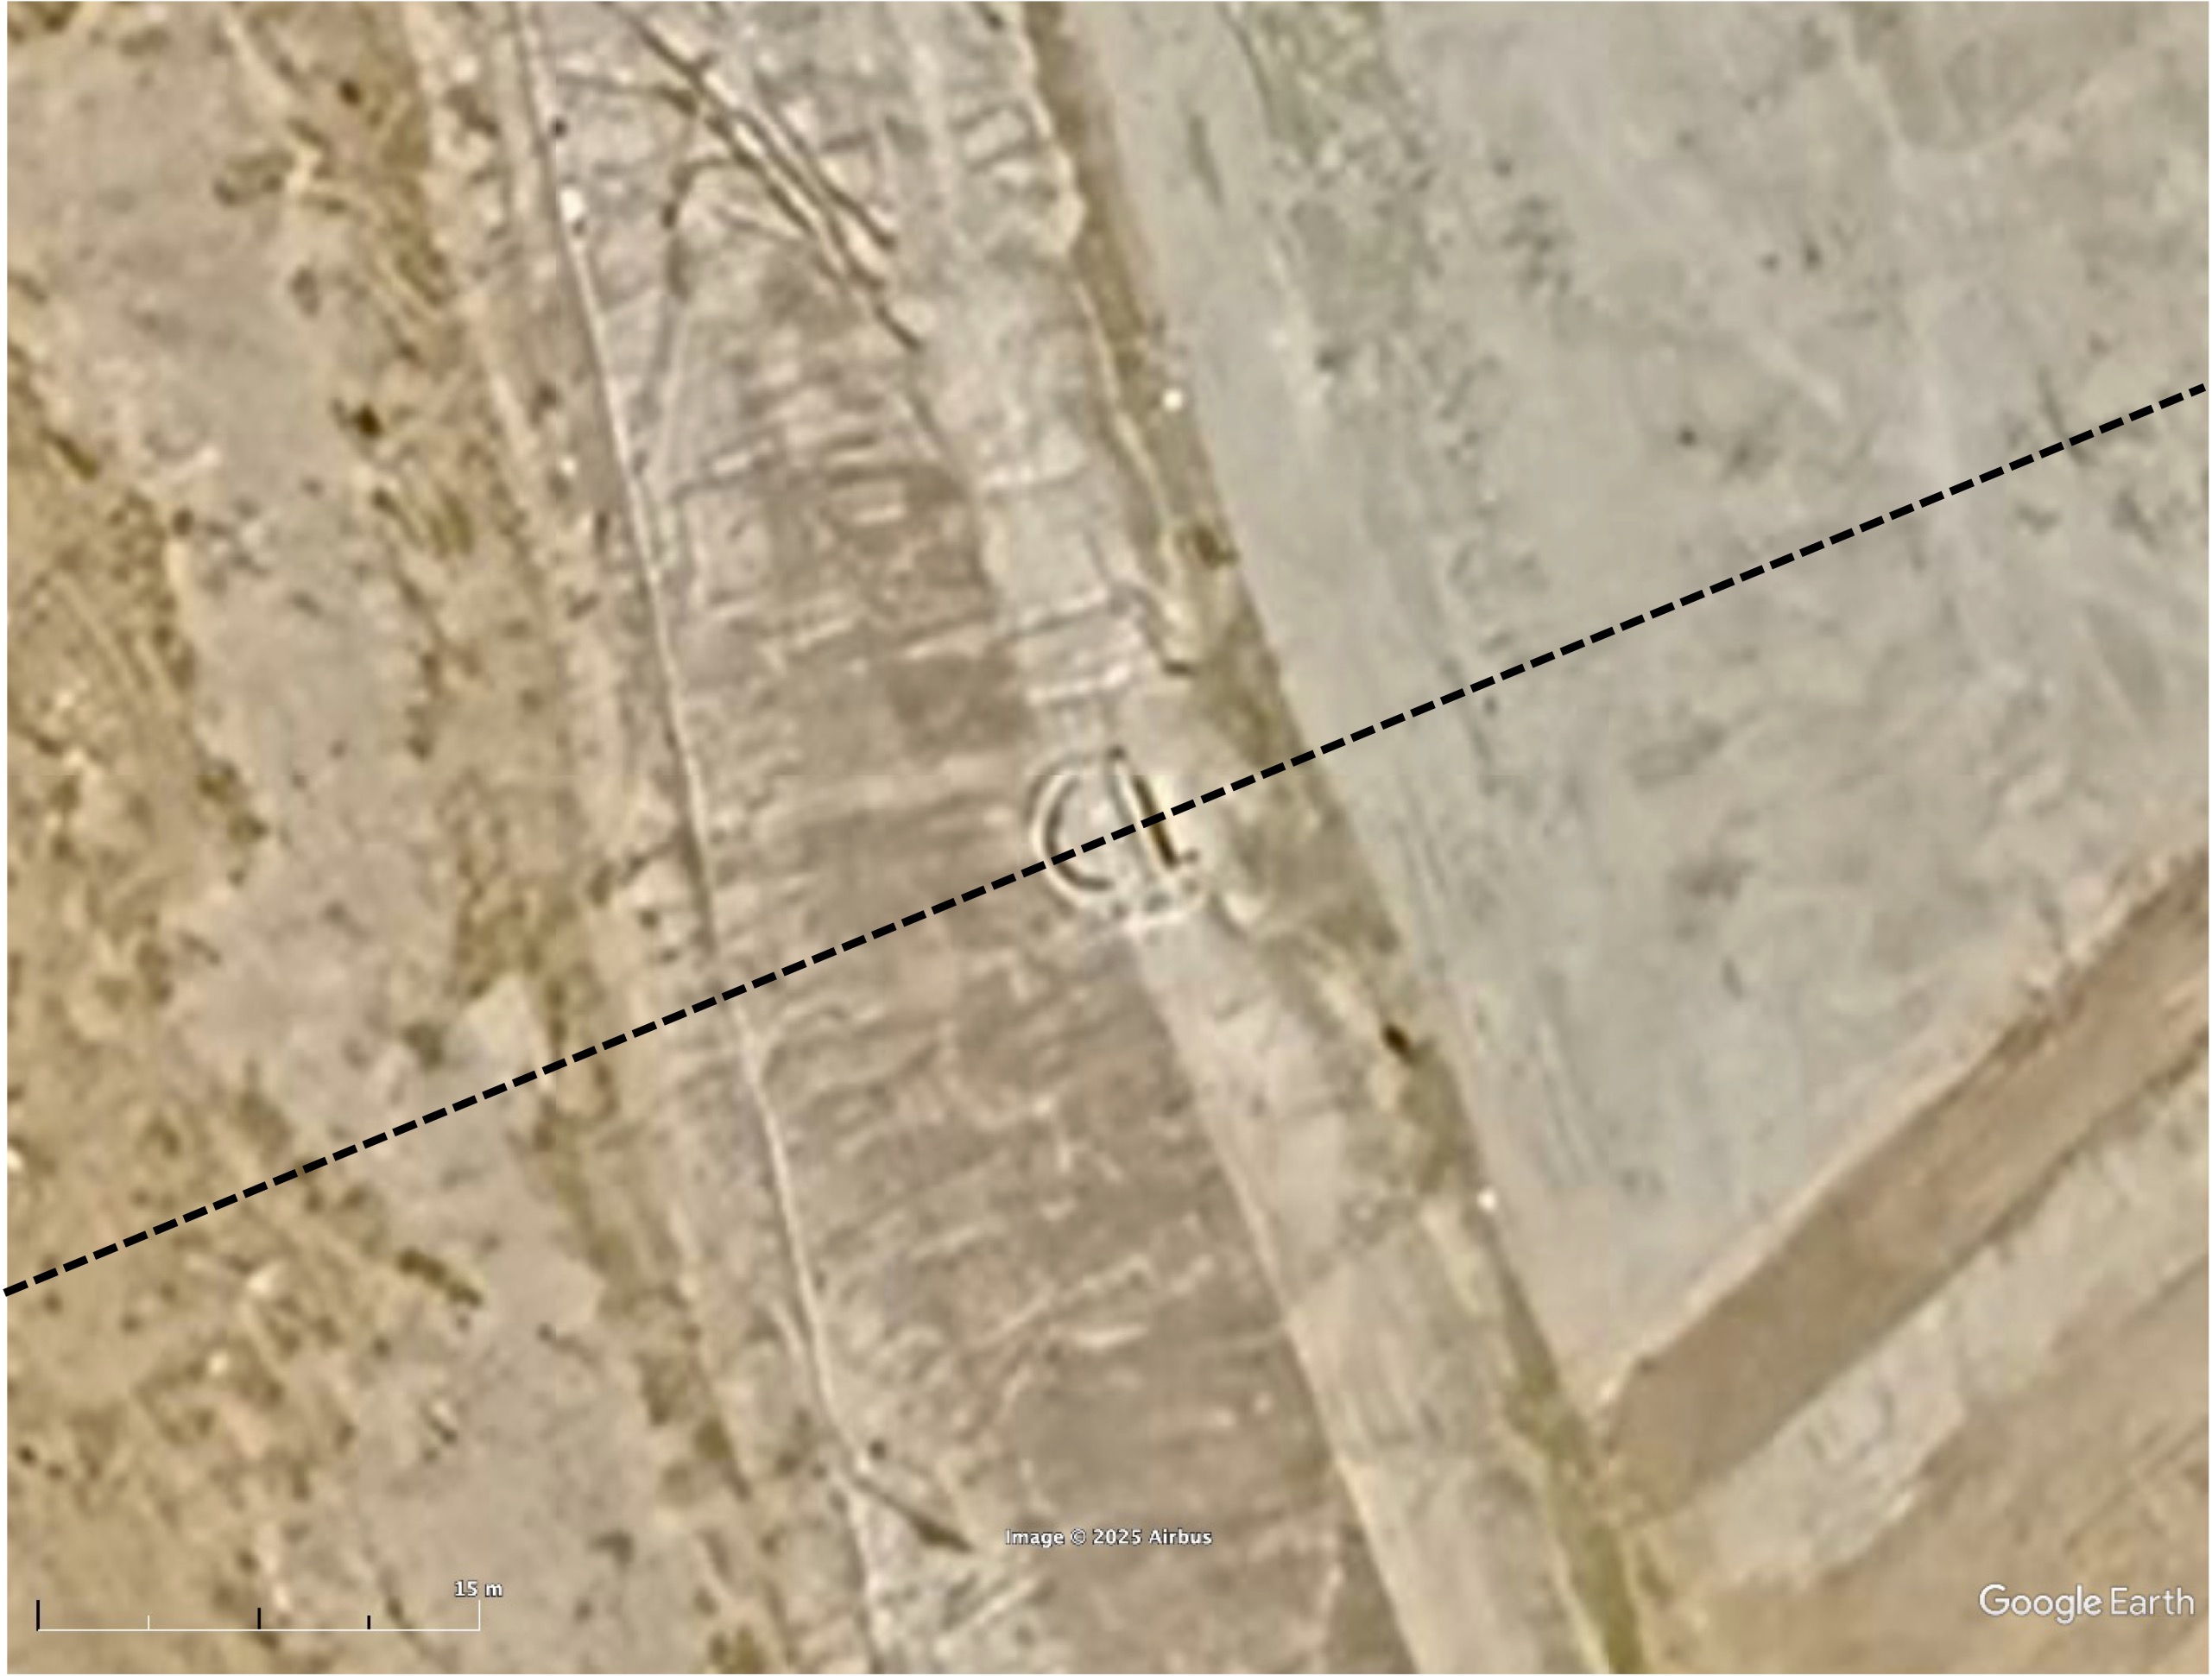
The megalith is approximately 11 meters (36 feet) long, 8 meters (26 feet) wide, and 4.7 meters (15 feet) high. It lies in a trench with its long axis running roughly east–west and sloping down from north to south. Partially obscured by trees, it is difficult to precisely measure its orientation from Google Earth imagery as we have done for the other sites. Using a historical photo of the site and a 3D model, we can confirm that its long axis is aligned roughly east-west.
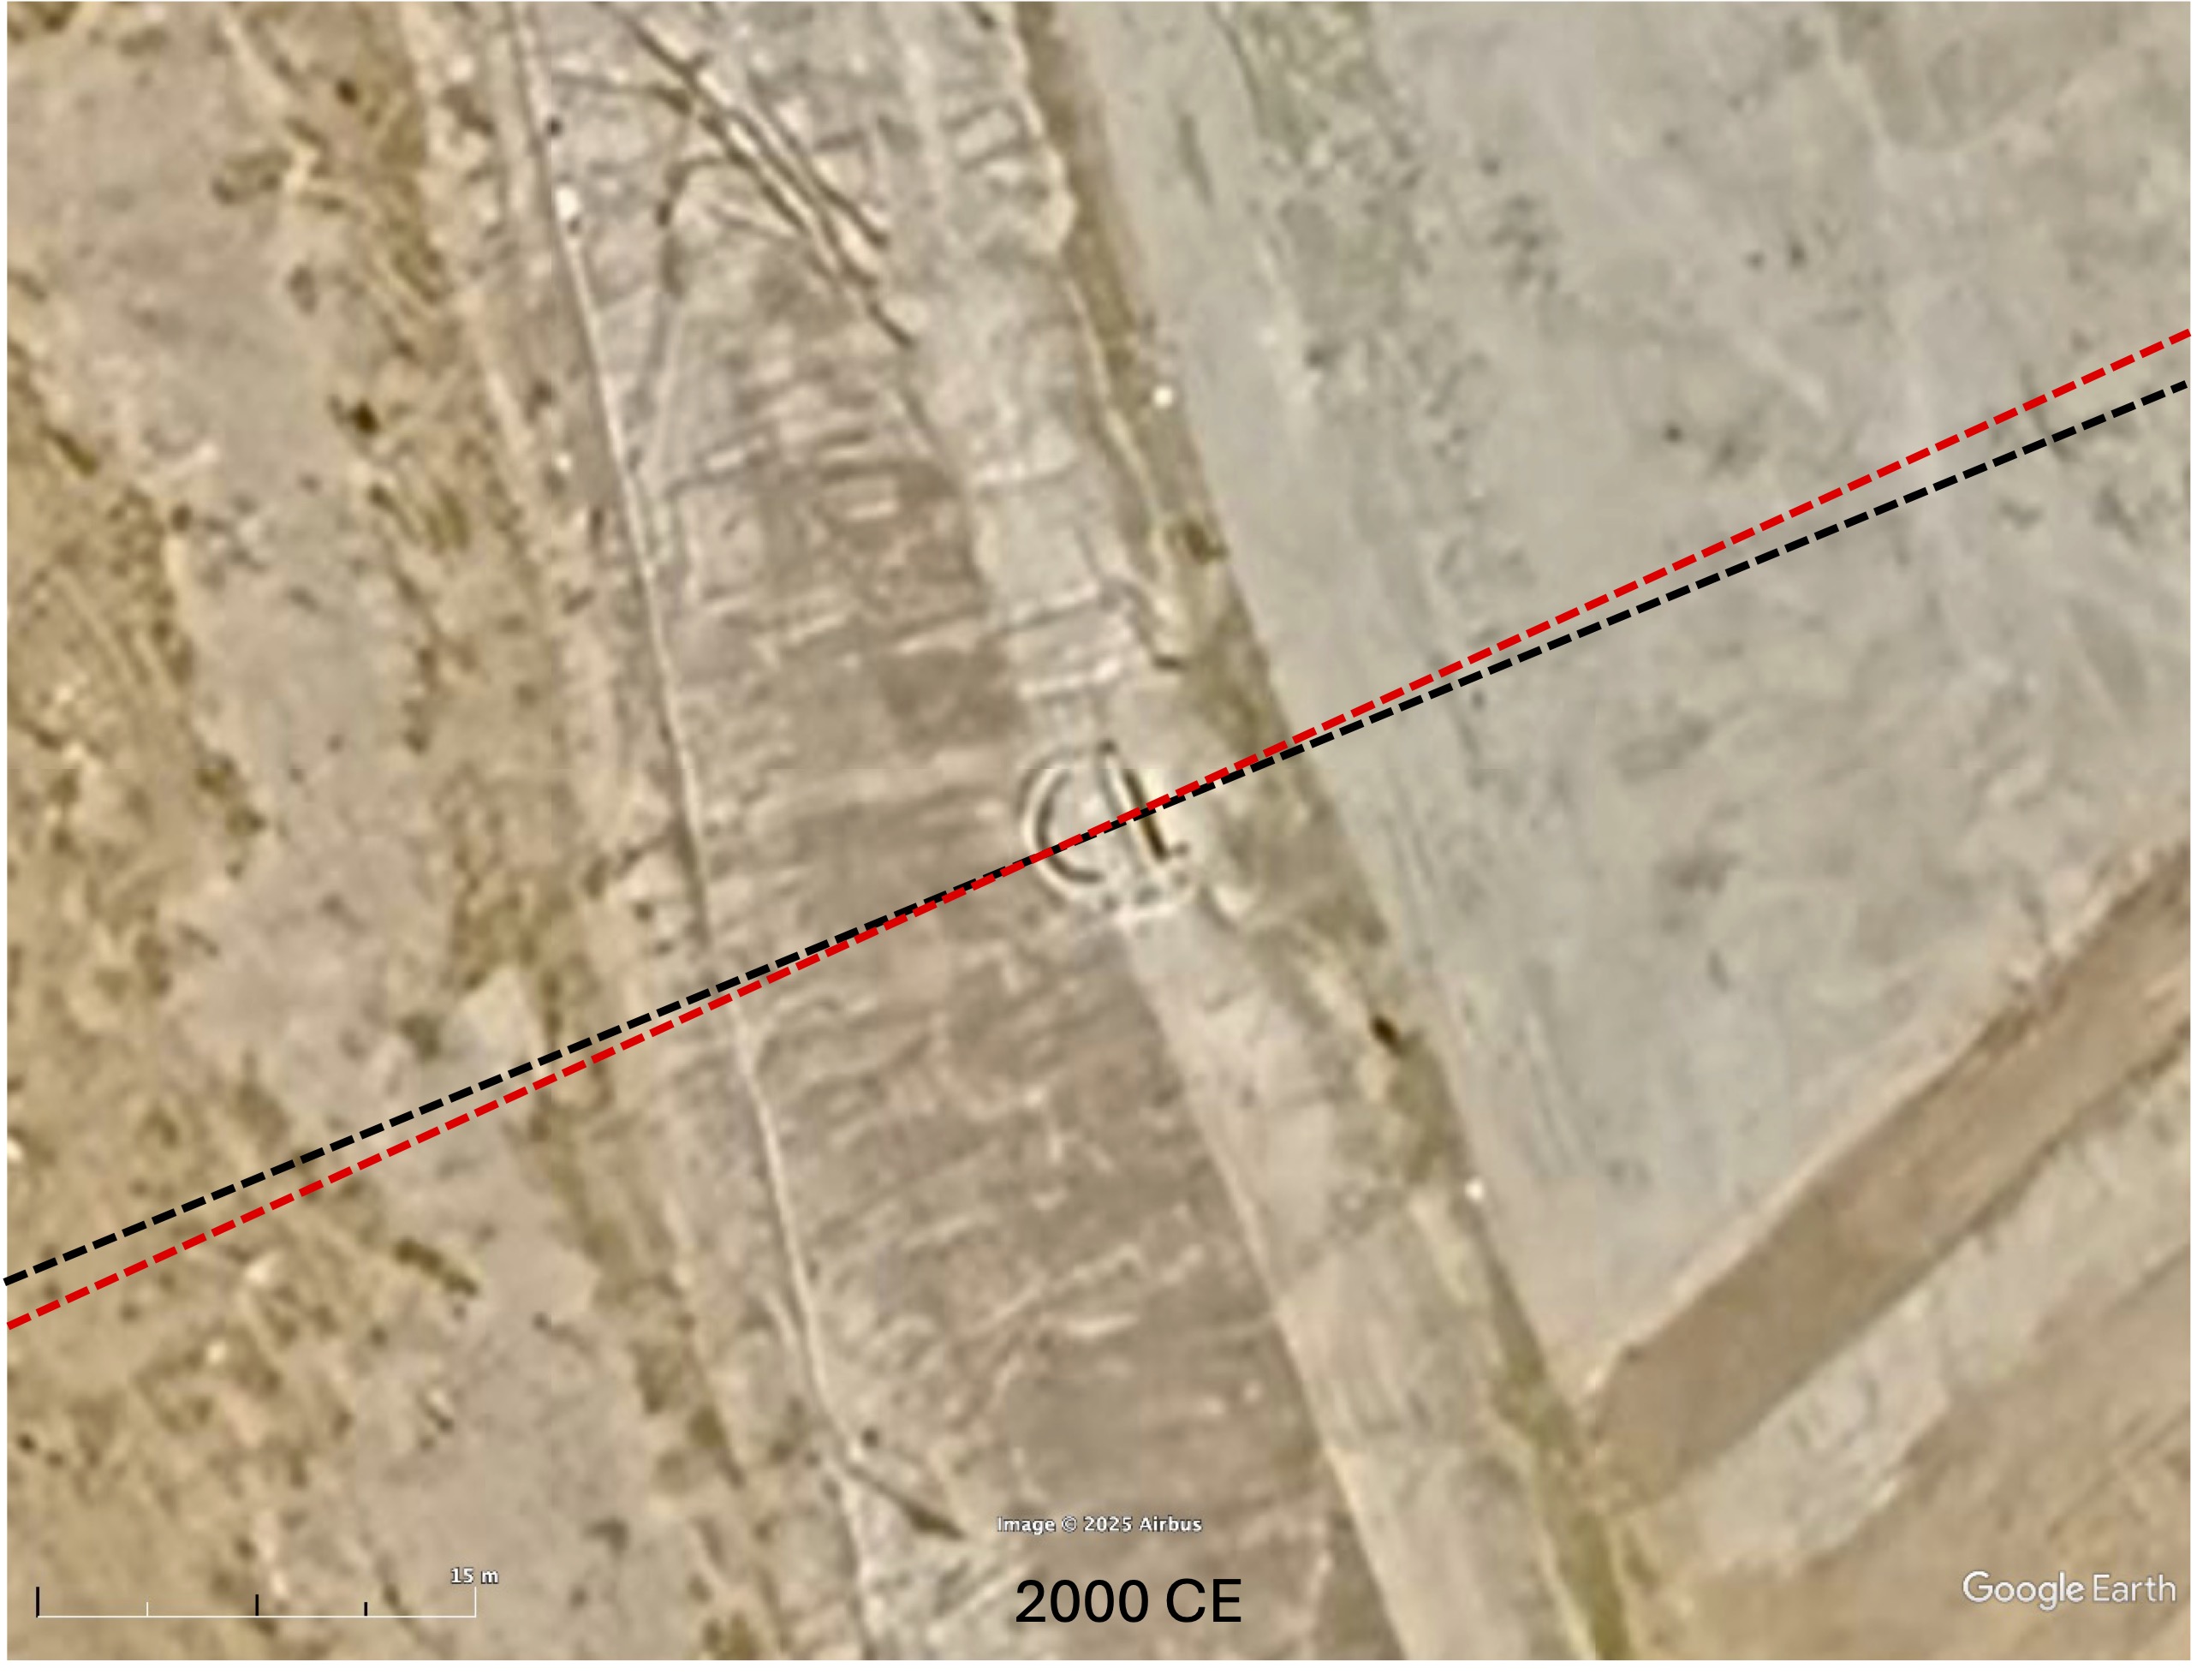
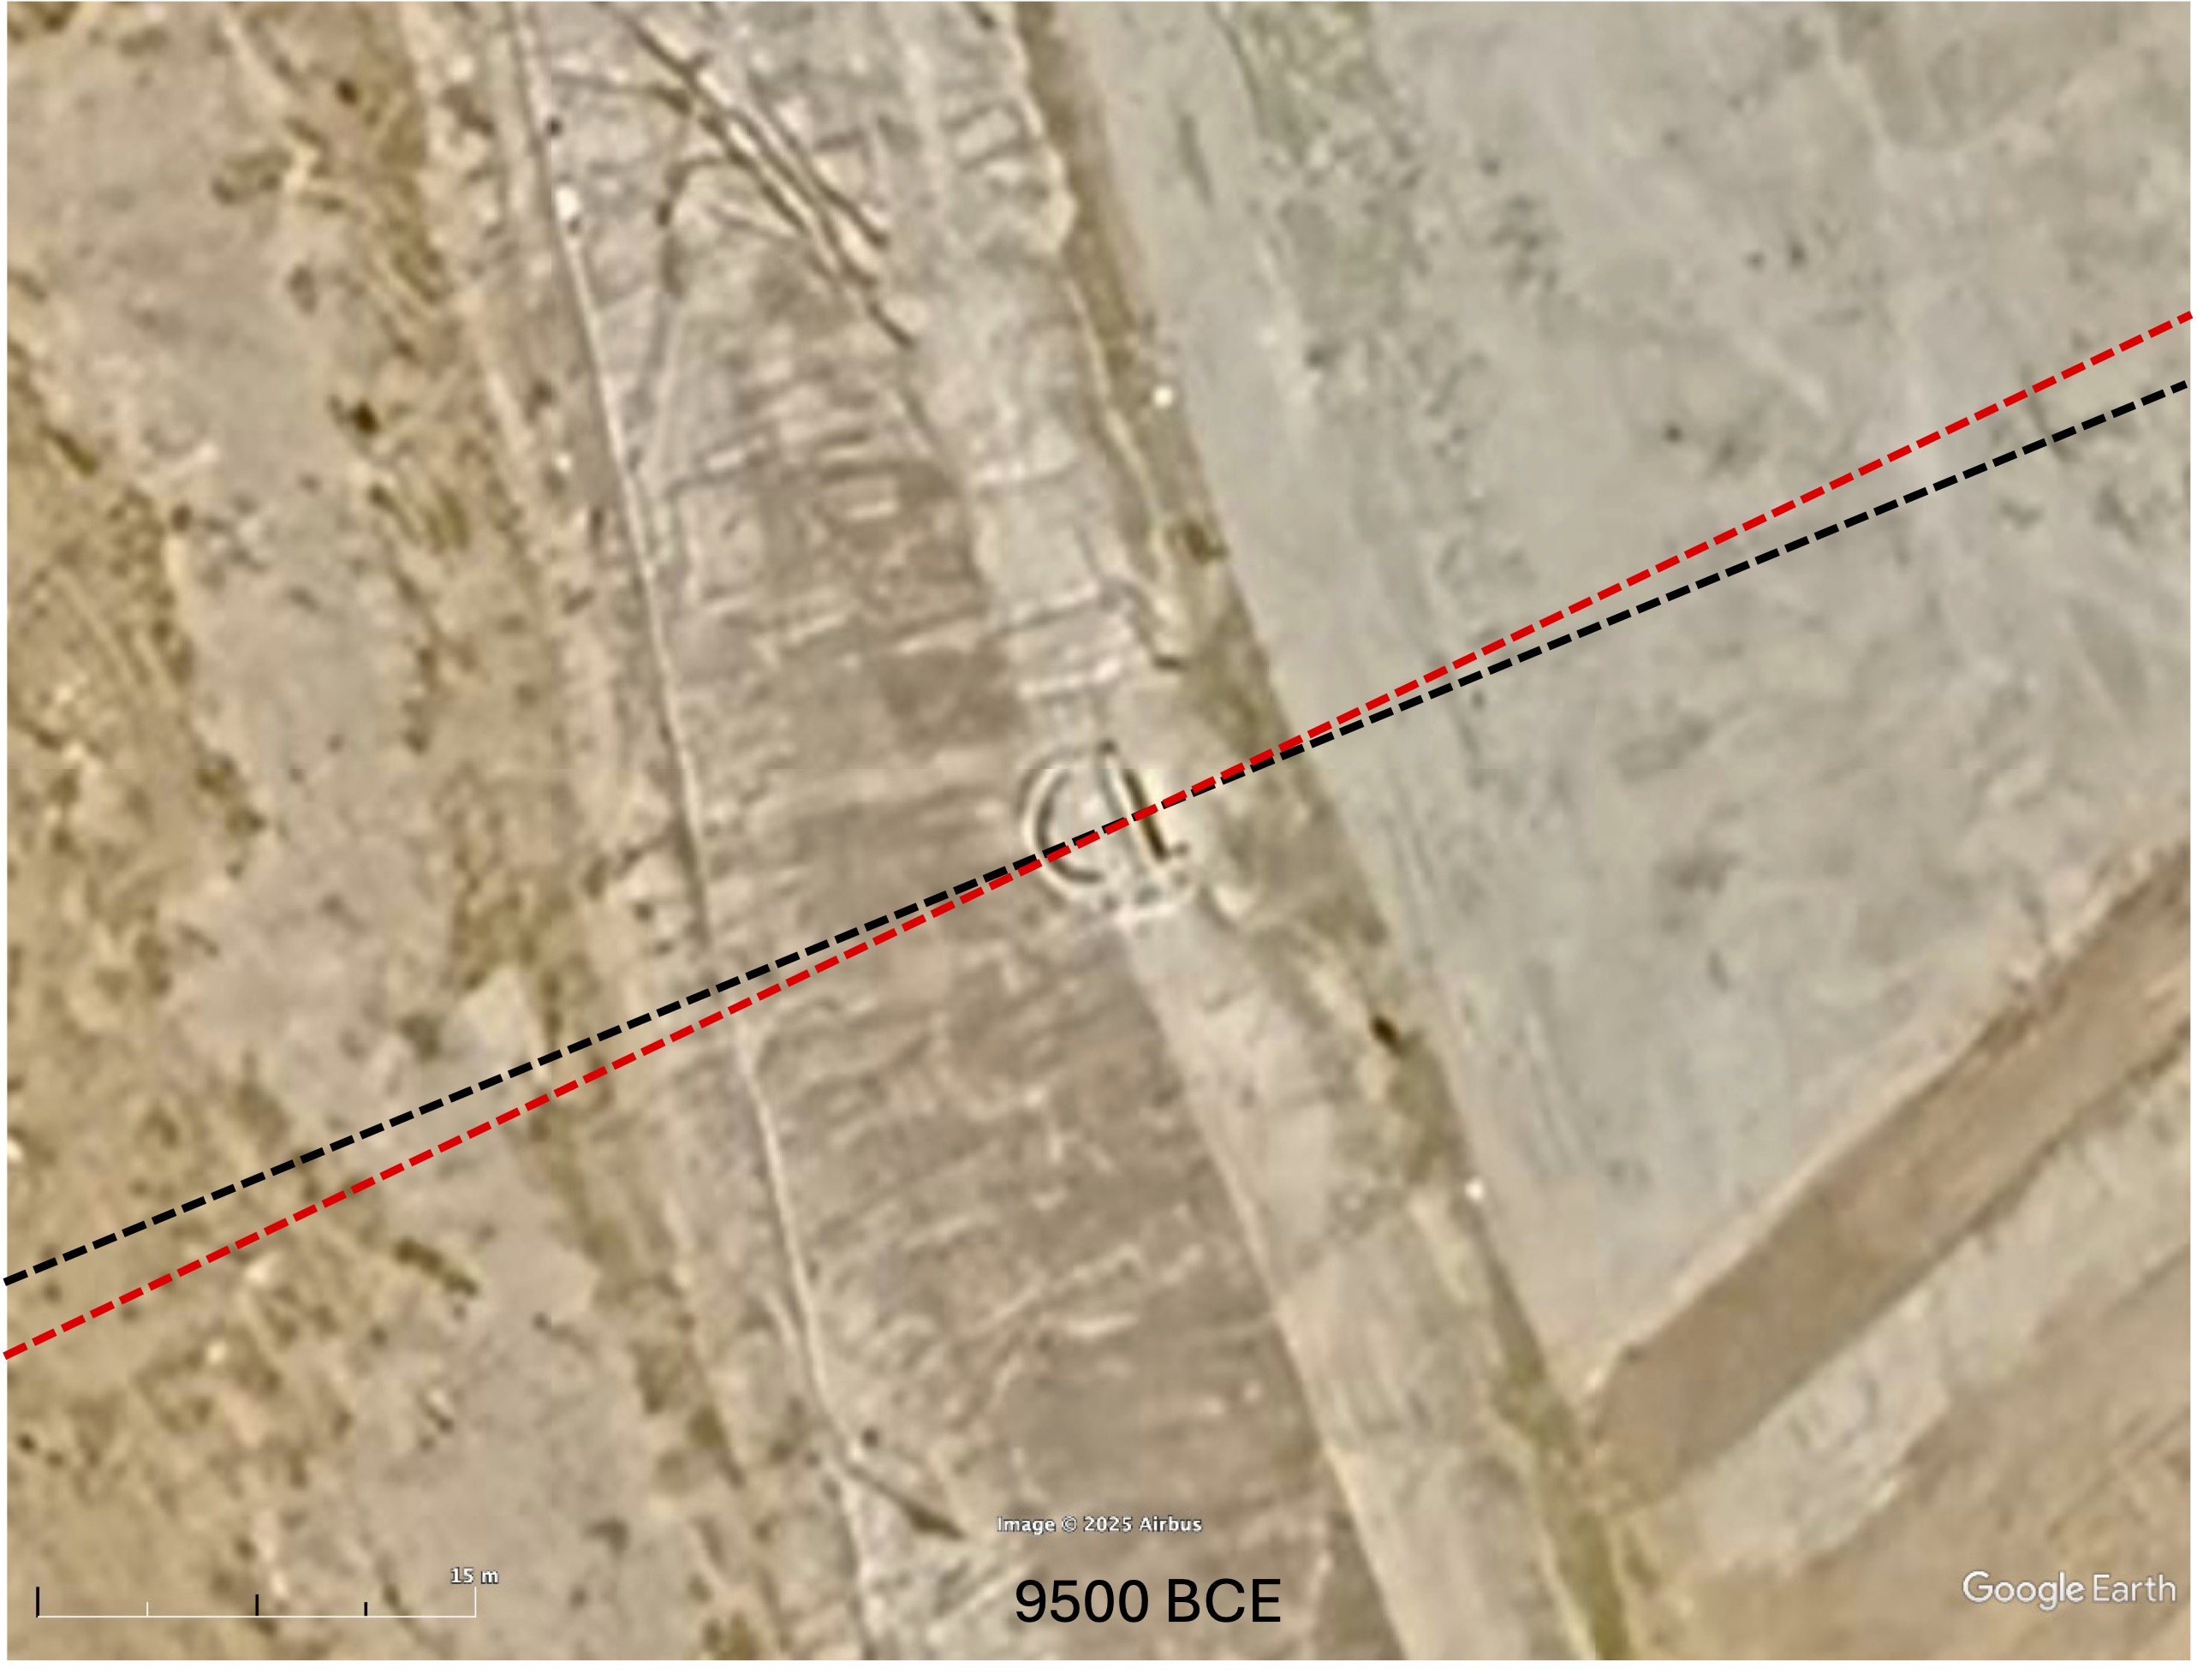
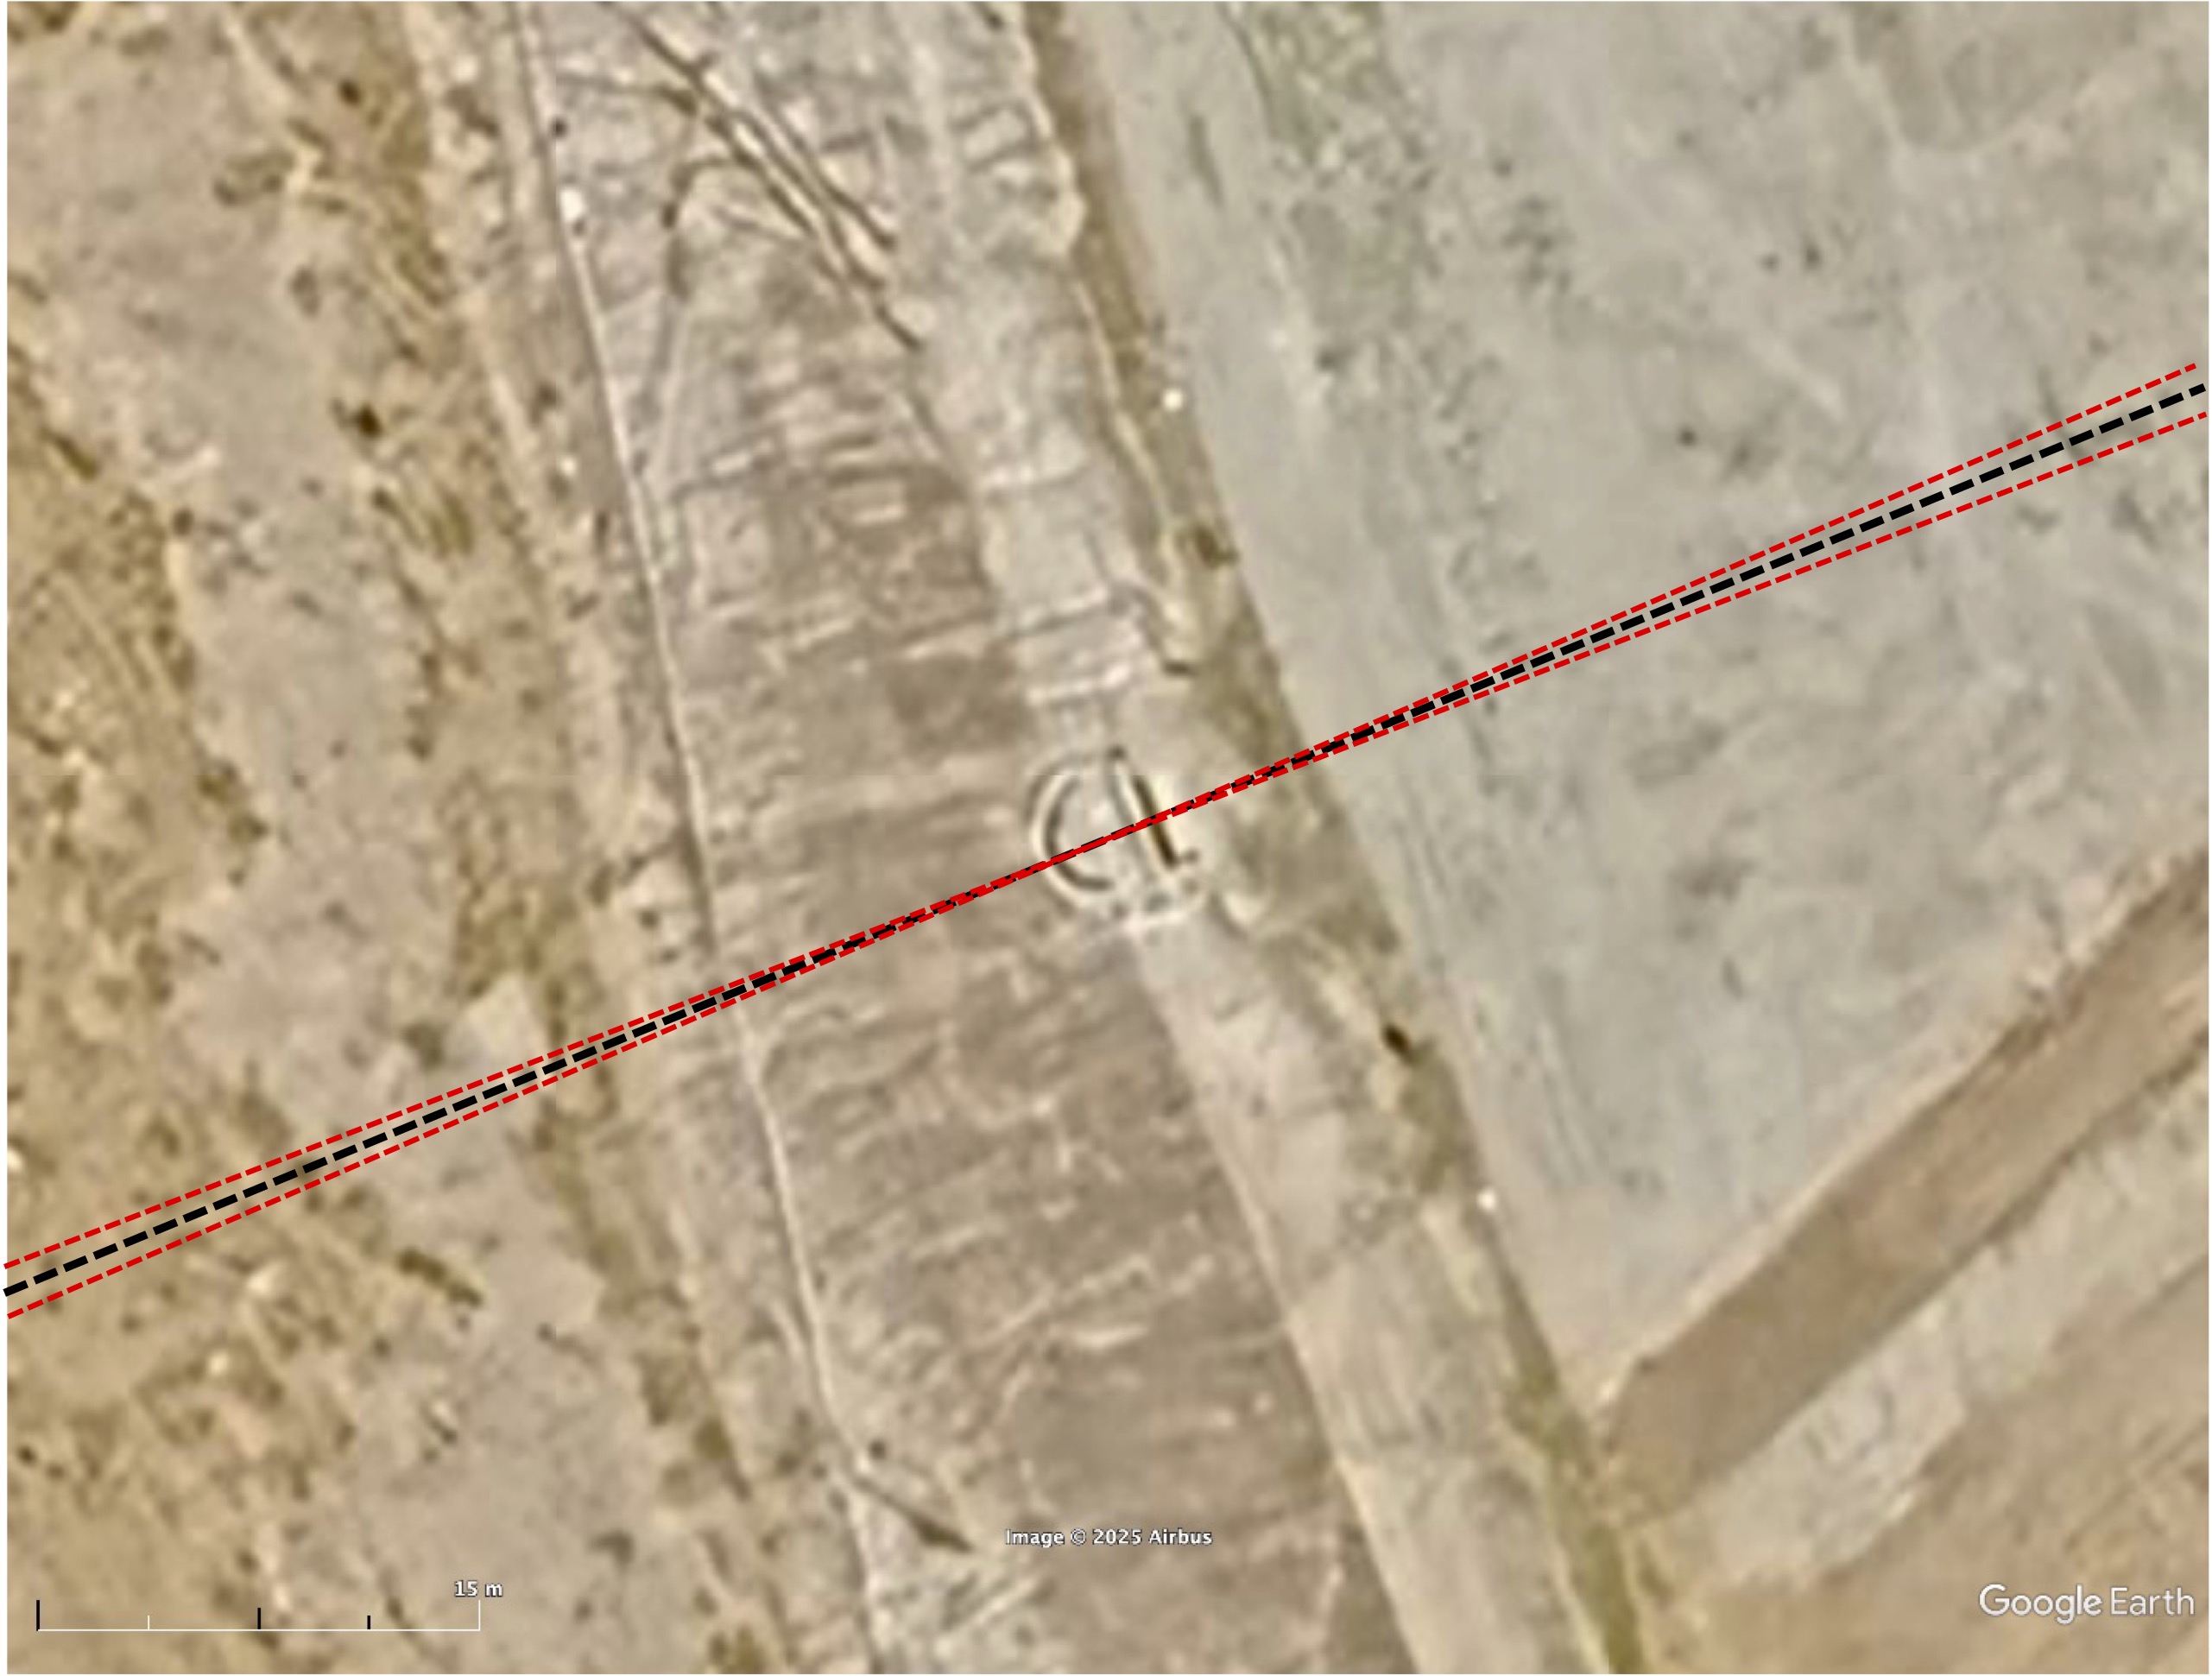
Using the most recent 2025 Google Earth image, a section of its long dimension side is visible and appears to be rotated about 4° south of east. As shown below, this is in the direction the Sun would rise just over the hills to the east on the equinox. Unlike Shinto and Zen sites that are rotated slightly to be perpendicular to the equinox sunrise direction over an elevated horizon, Masuda no Iwafune lies parallel to it.
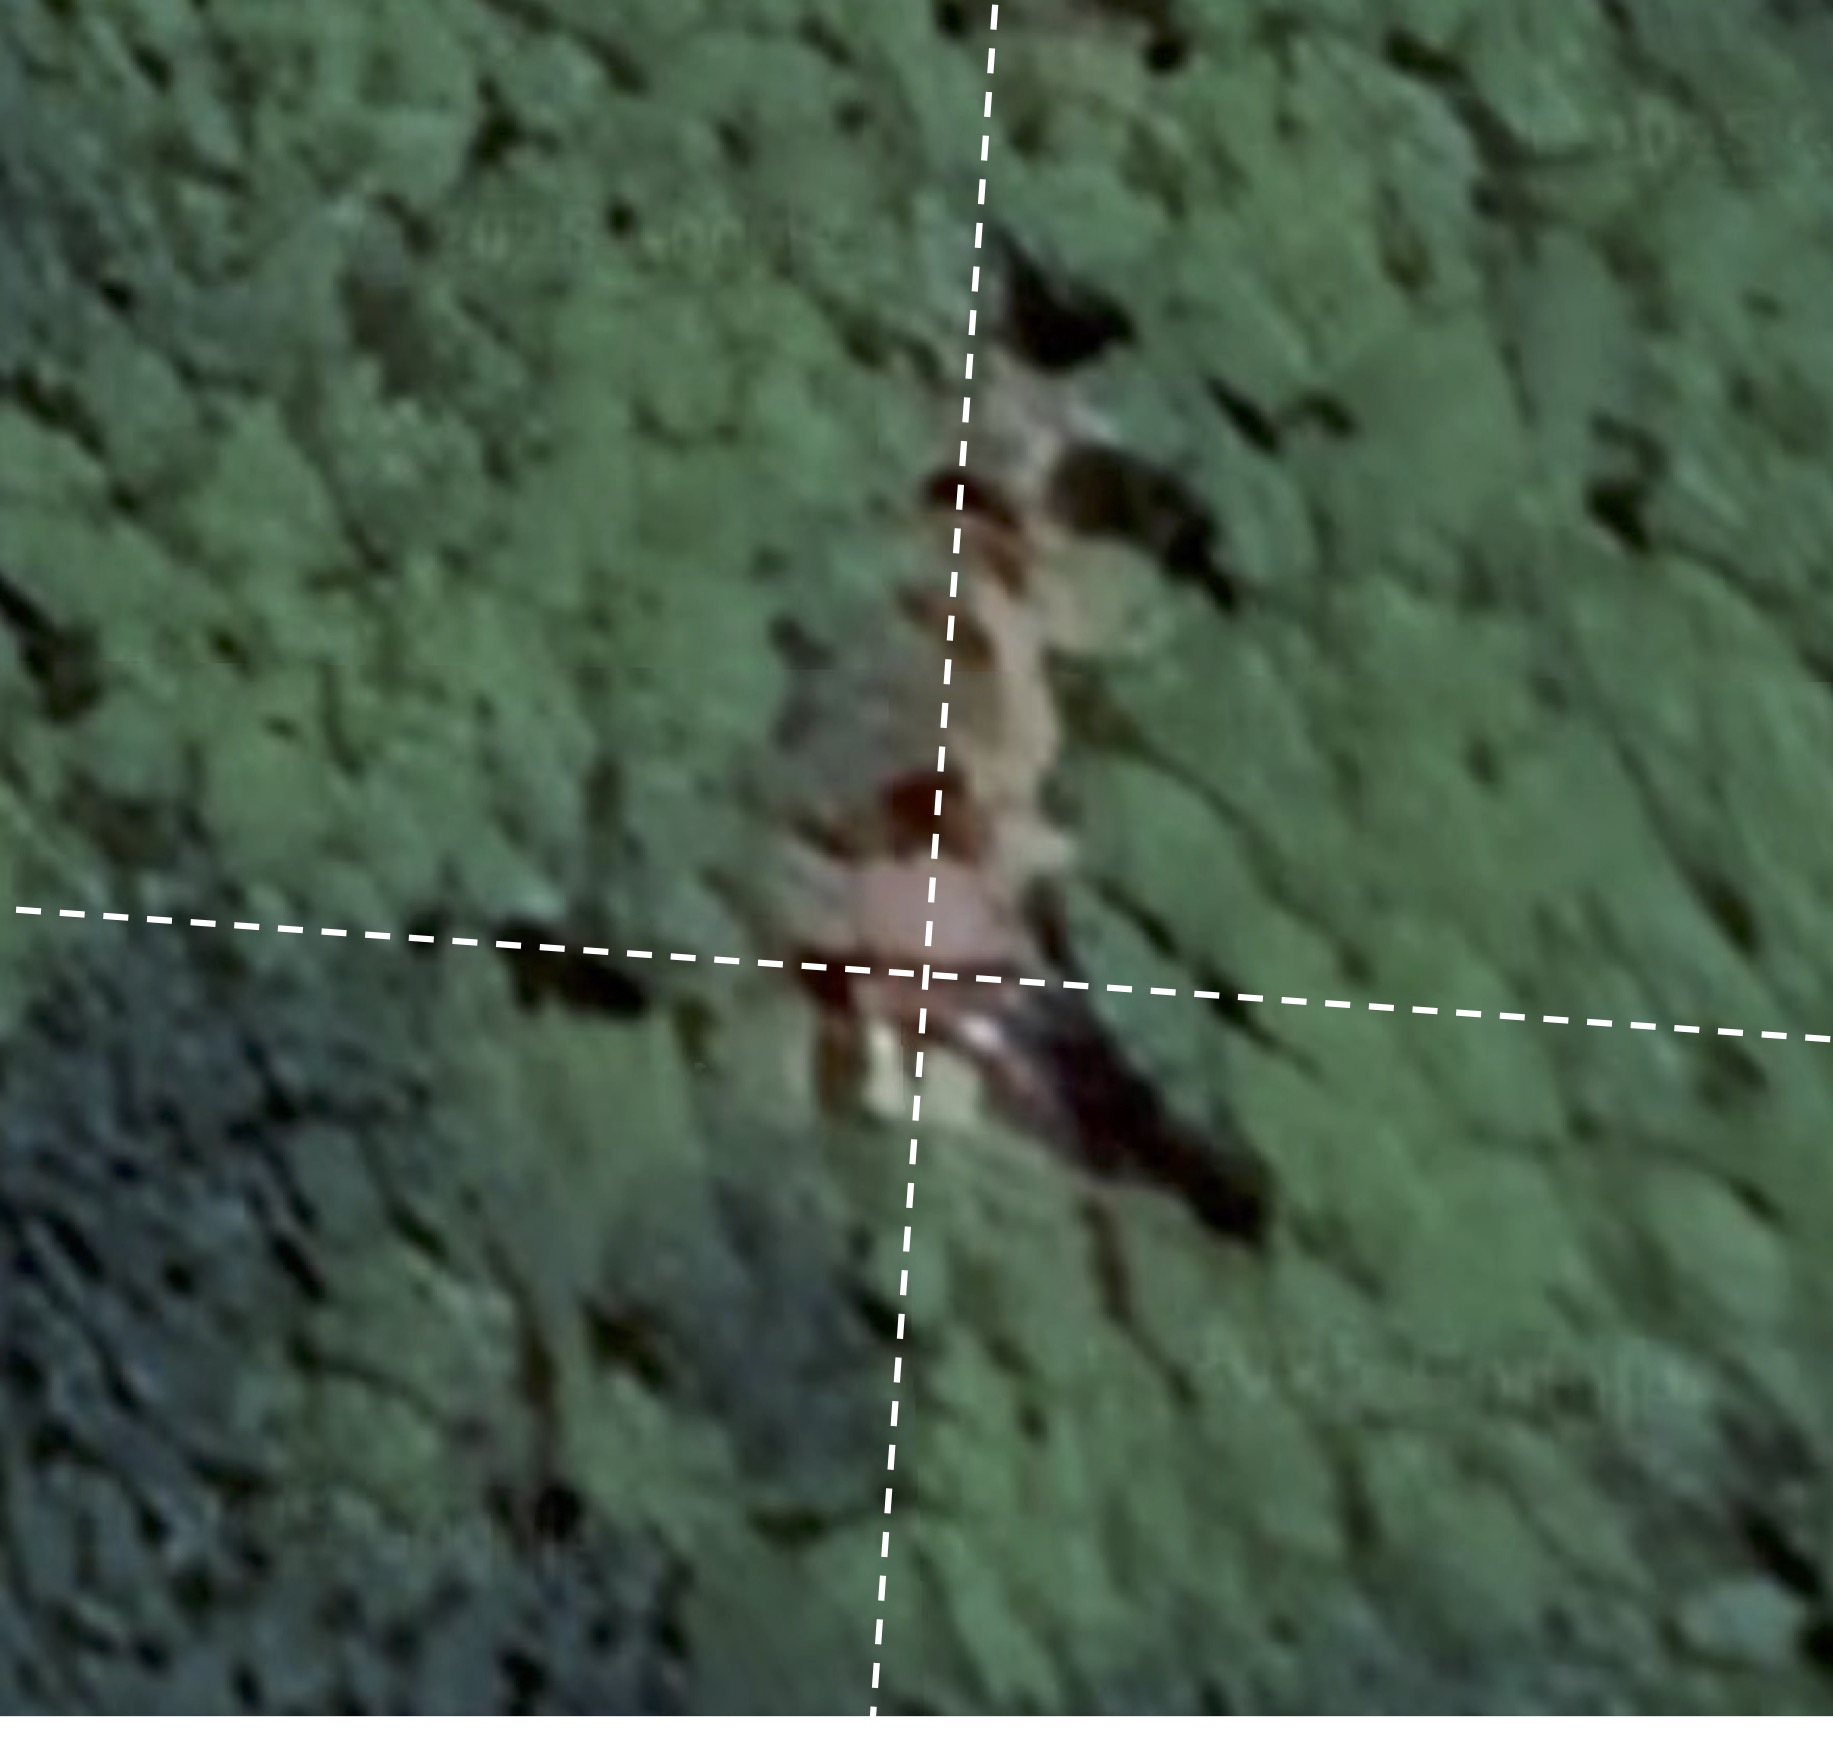
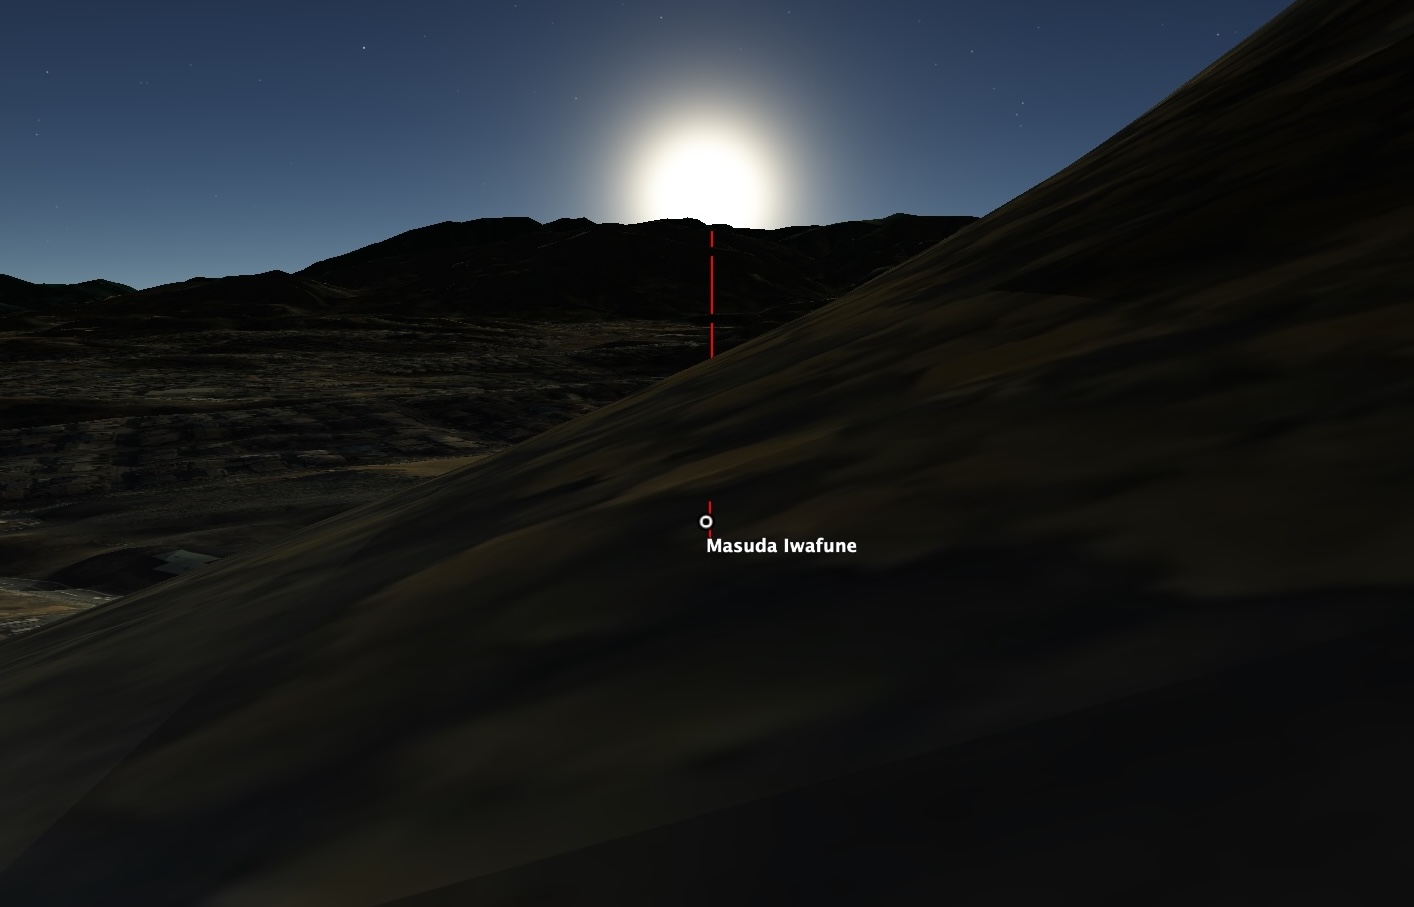
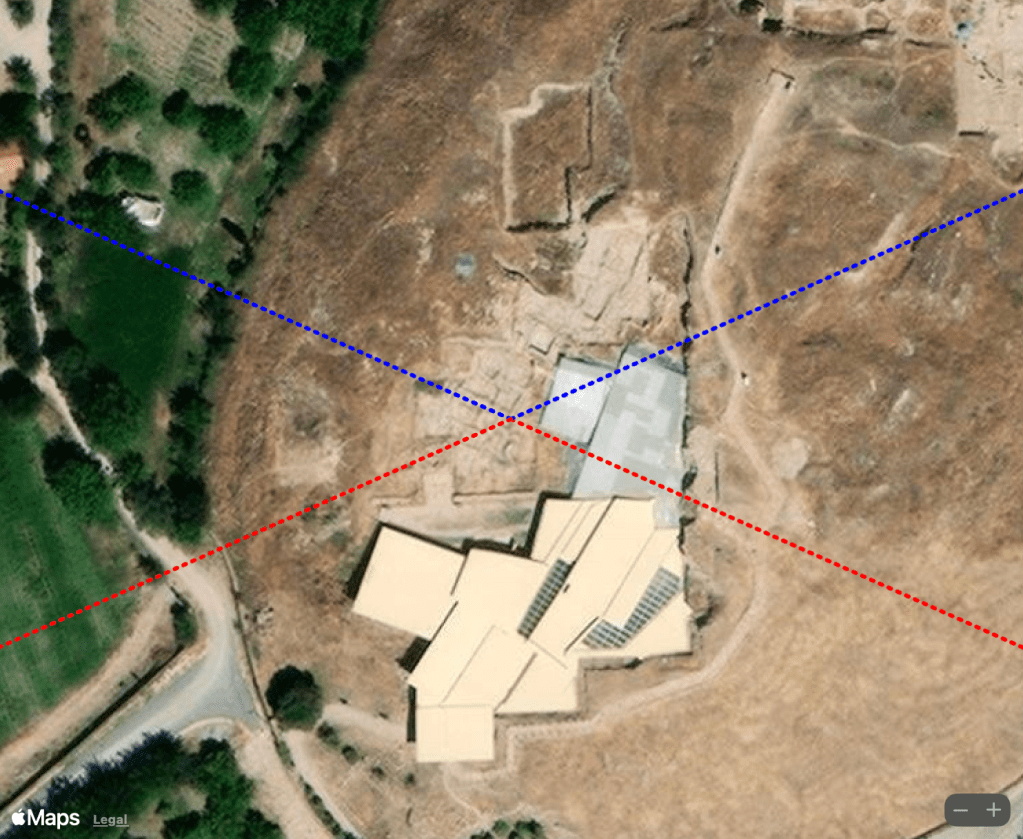
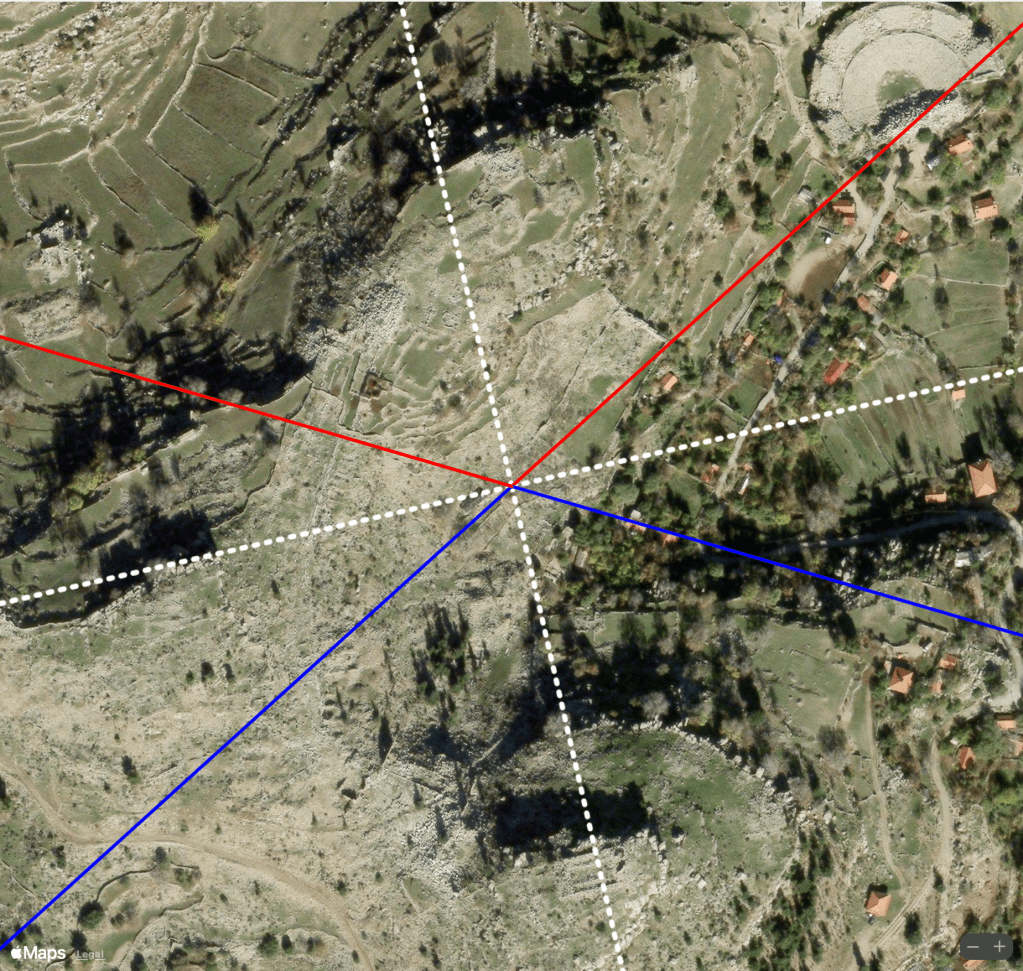
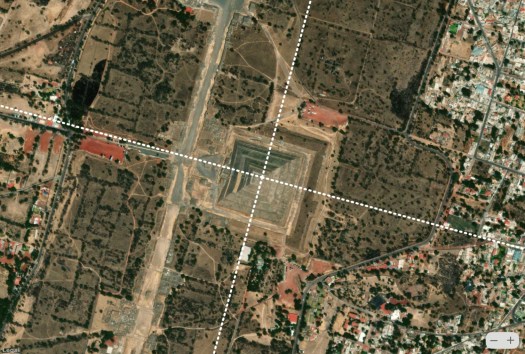
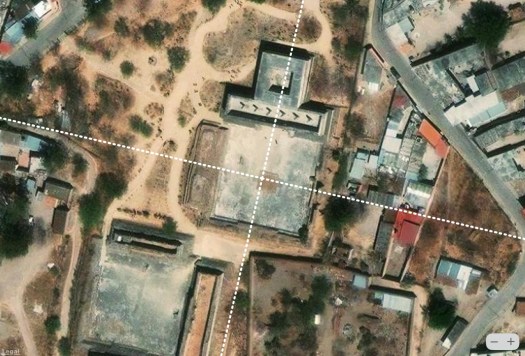
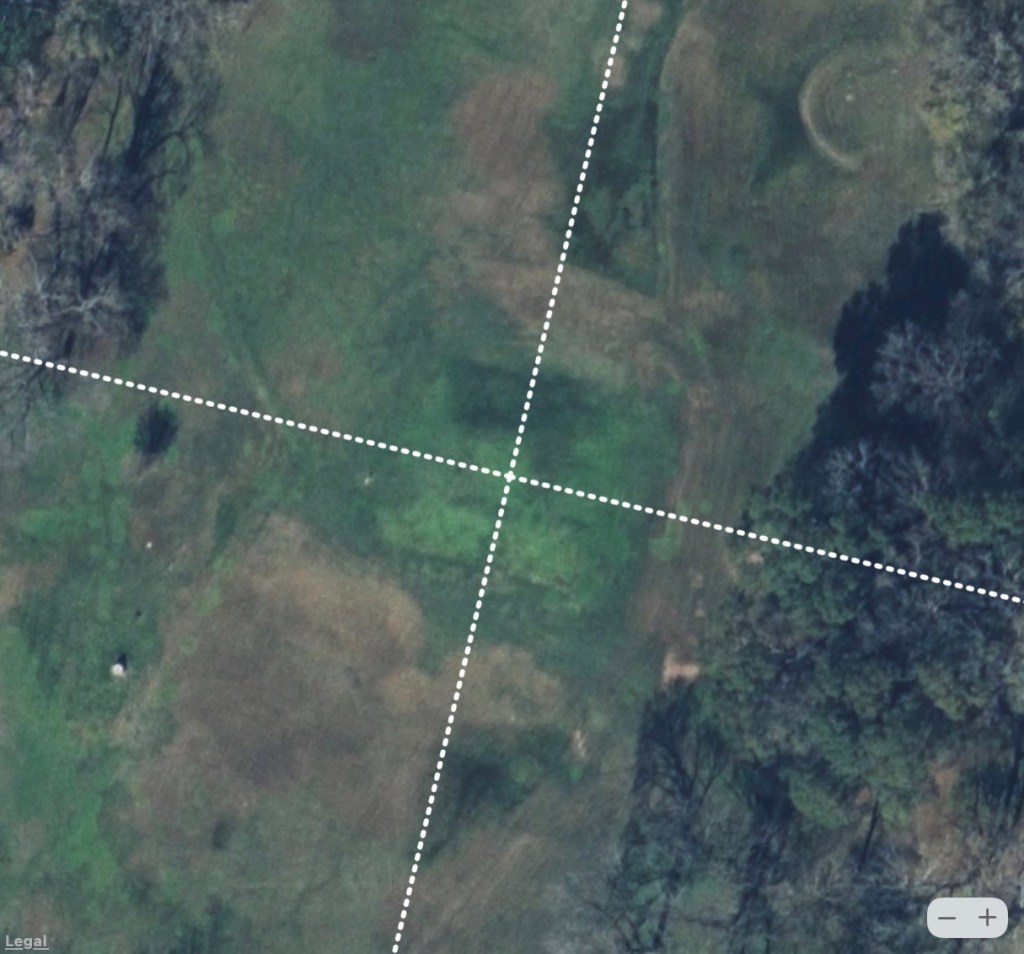
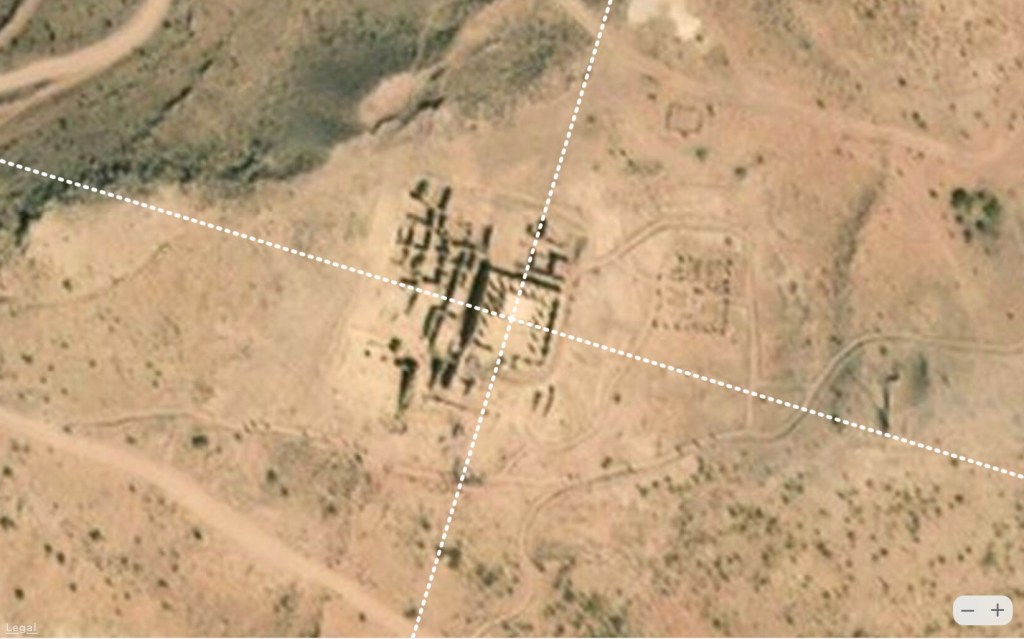
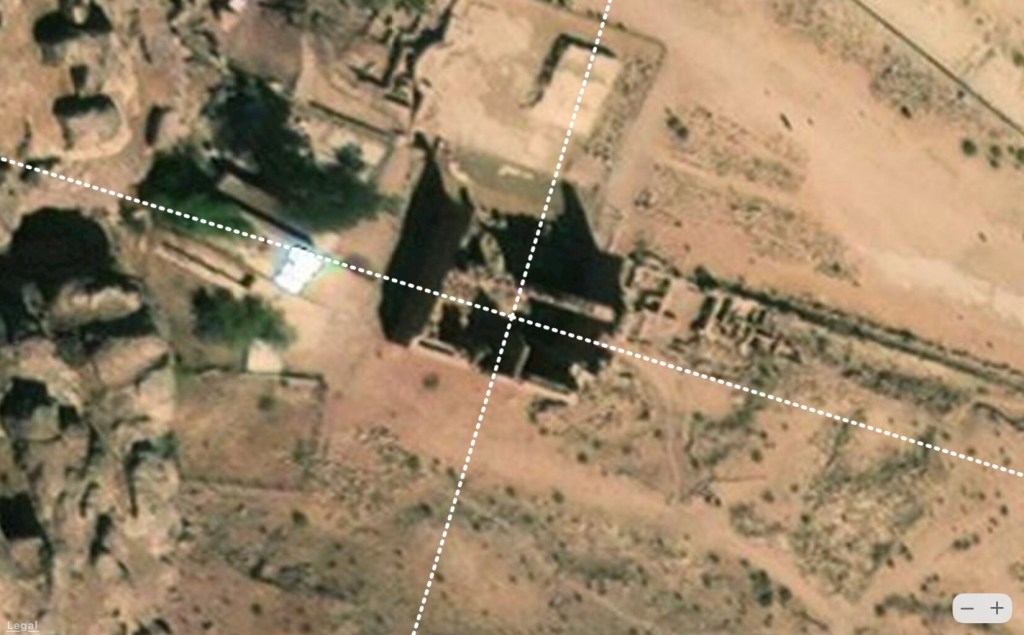
Visible part of Masuda no Iwafune with reference lines rotated 4° east of north (left) and horizon view at 4° south of east at sunrise on the equinox. (Google Earth)
Although it is generally dated to the Asuka and Nara periods, Masuda no Iwafune is not mentioned in Japanese historical chronicles and ancient records from that time. This seems strange as Japan’s centralized government was in the Asuka region (Nara Prefecture) in the early 6th century, moving to the first permanent capital, modern Nara, around 710, and finally settling in Kyoto in 794, which remained the seat of the imperial court for centuries.
Lacking other historical references, we turn to folklore and legend for clues concerning its origin and purpose. The name Iwafune literally means “stone boat”. Local folklore claims that it is a celestial ship in which the gods descended to Asuka. Some versions say the gods abandoned the stone ship after it became too heavy. Others say it marks a site where a deity landed during the creation of Japan. A long-standing folktale says the stone was meant to be a tomb for a ghost or giant, but the builders were frightened by supernatural events and abandoned the work. Sometimes the “giant” is identified with monsters who supposedly lived in the hills of Asuka. This story may reflect the stone’s incomplete appearance and mysterious trench. According to another legend, Masuda no Iwafune, which lies between ancient shrines on the mountain, is a boundary marker placed by the gods themselves to delineate the sacred mountain. Some villagers historically believed it was a kami’s dwelling stone and is one of the reasons it has never been removed or cut for building stone despite being granite.
Current opinion is that Masuda no Iwafune was a tomb that was started but never finished sometime during the Asuka and Nara periods.
Discussion
Structures built during the Kofun Period appear are aligned astronomically to the arc of the Sun and Moon, and in some cases to the southernmost rising and northernmost setting of the Sun and Moon. Lacking other explanations, several kofun might have been aligned geomagnetically like the Chinese pyramids. Heavily influenced by Chinese Buddhist architectural traditions and indigenous beliefs, temples built during the Shinto and Zen periods tended to be aligned to the cardinal directions. Later influenced by Chinese geomancy, castles and the surrounding towns built during the Shogunate Period were often aligned in geomagnetic directions.
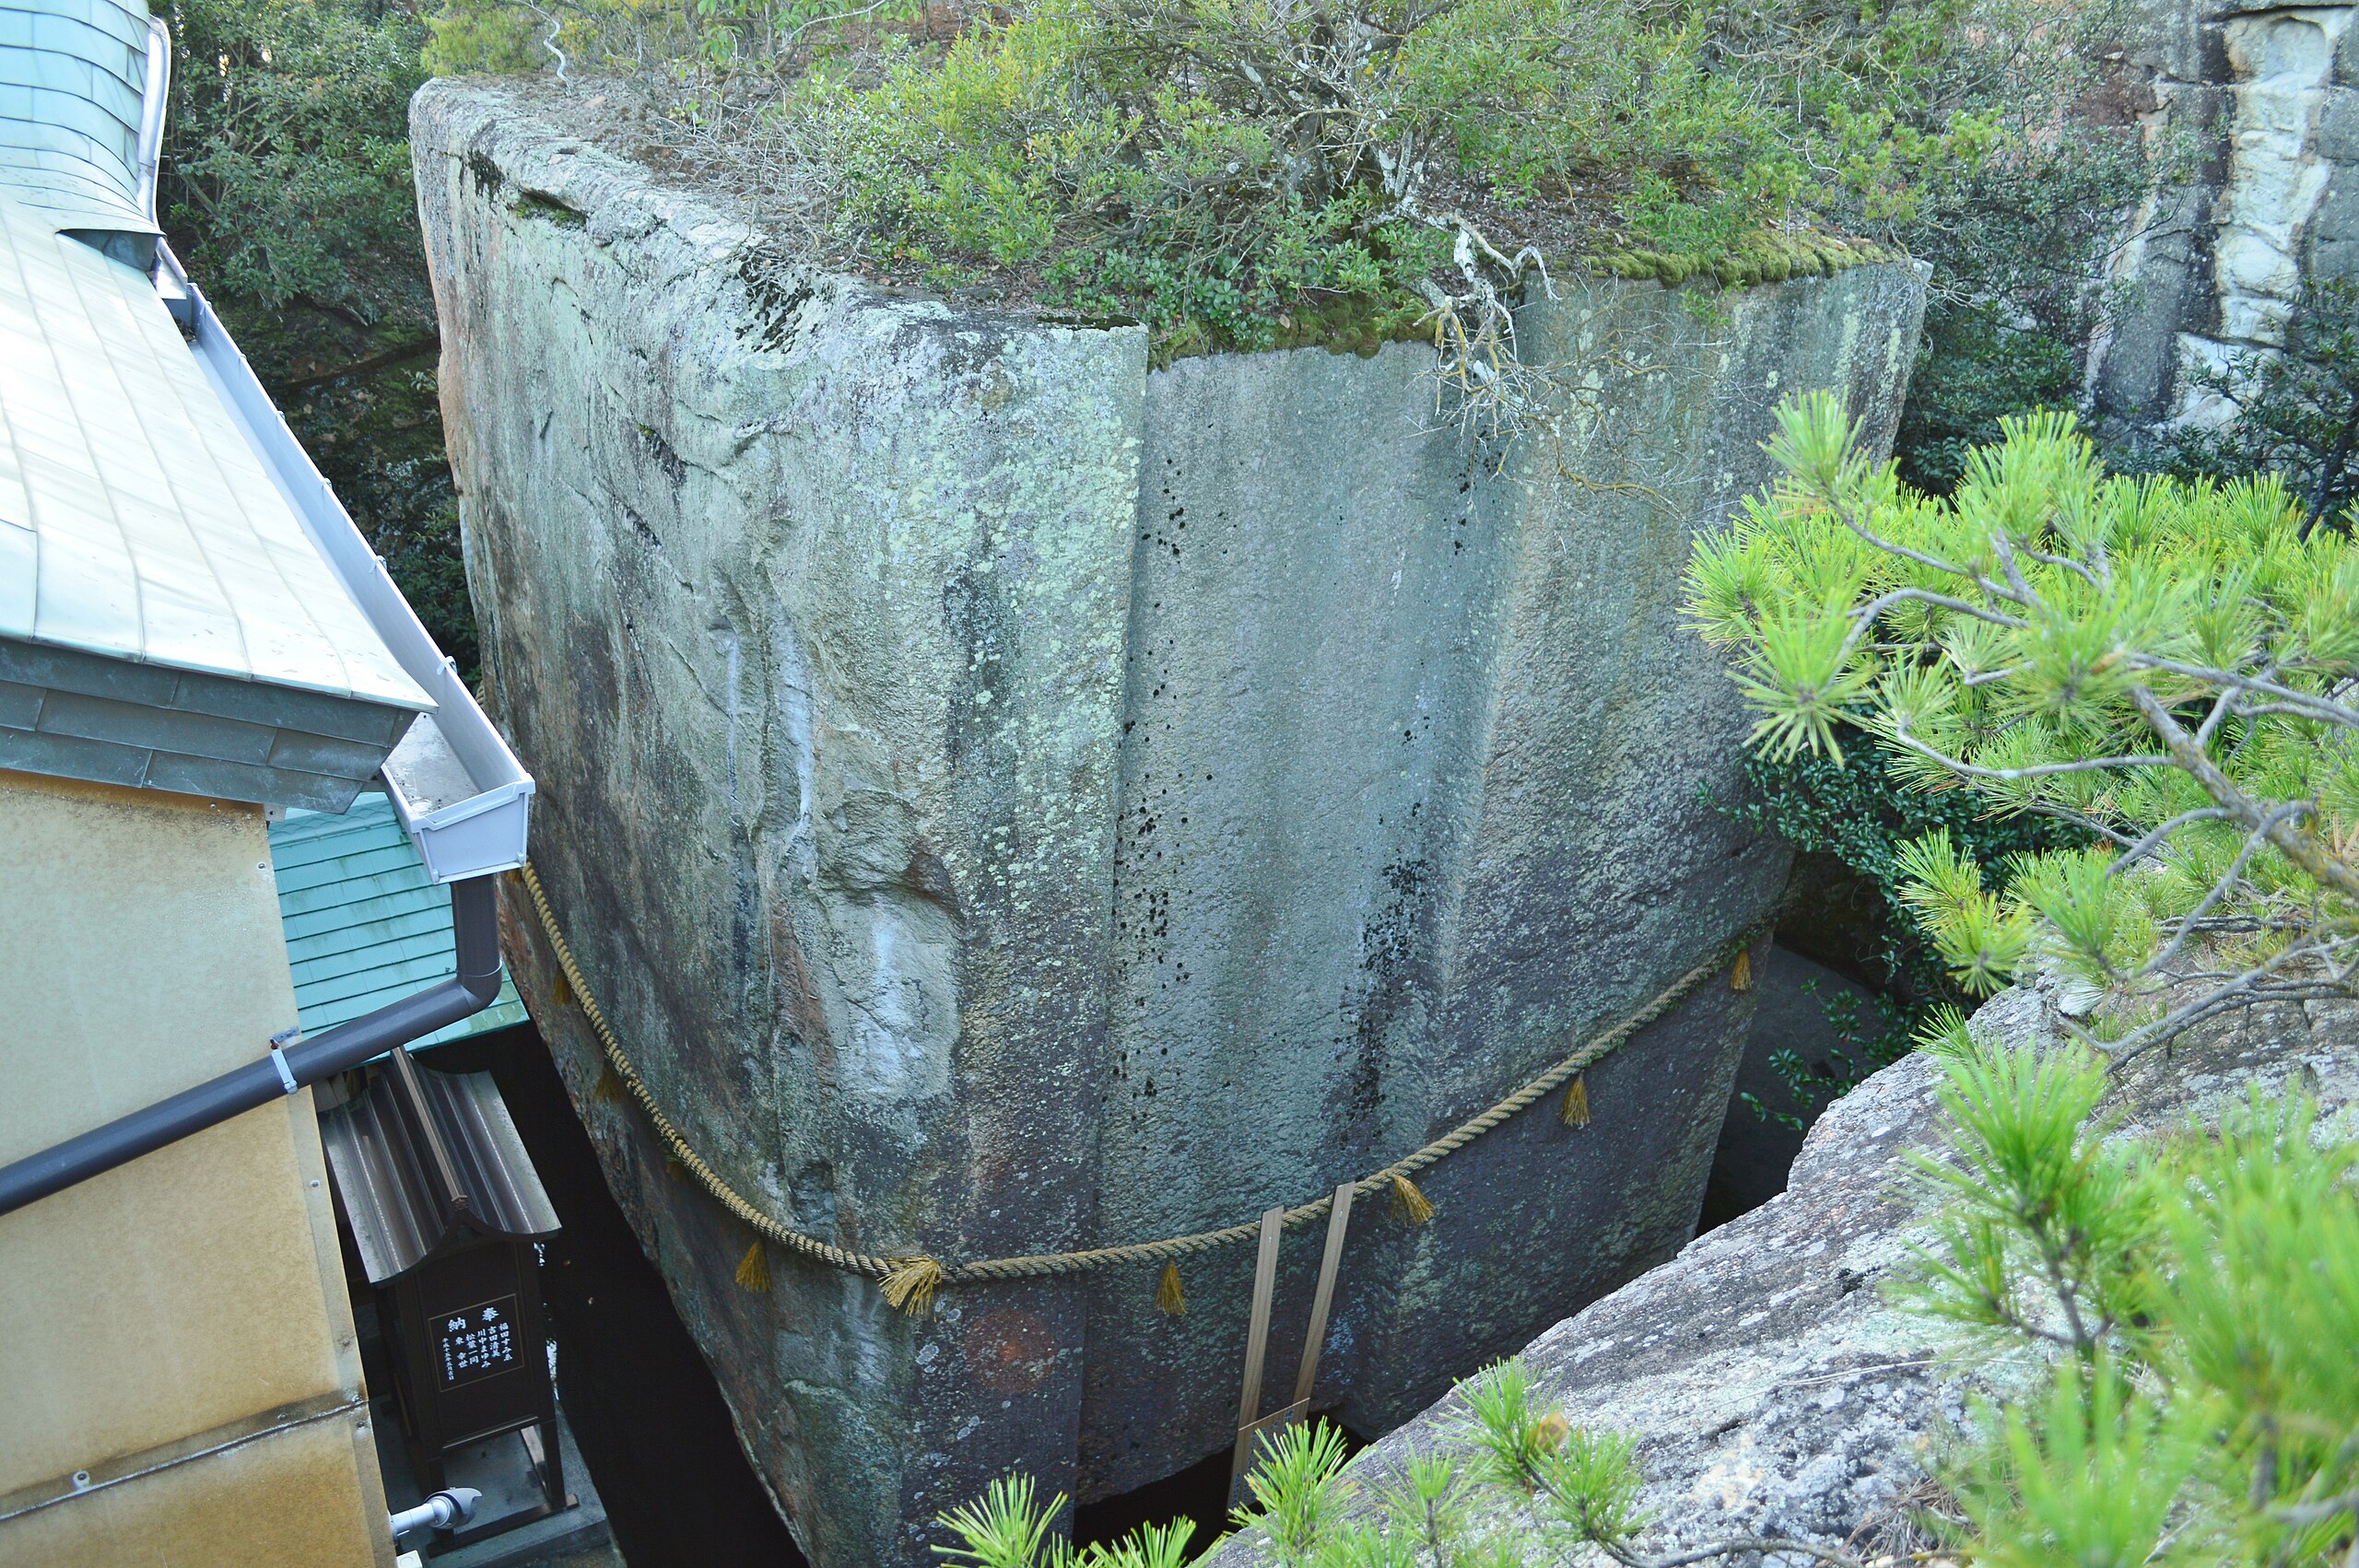
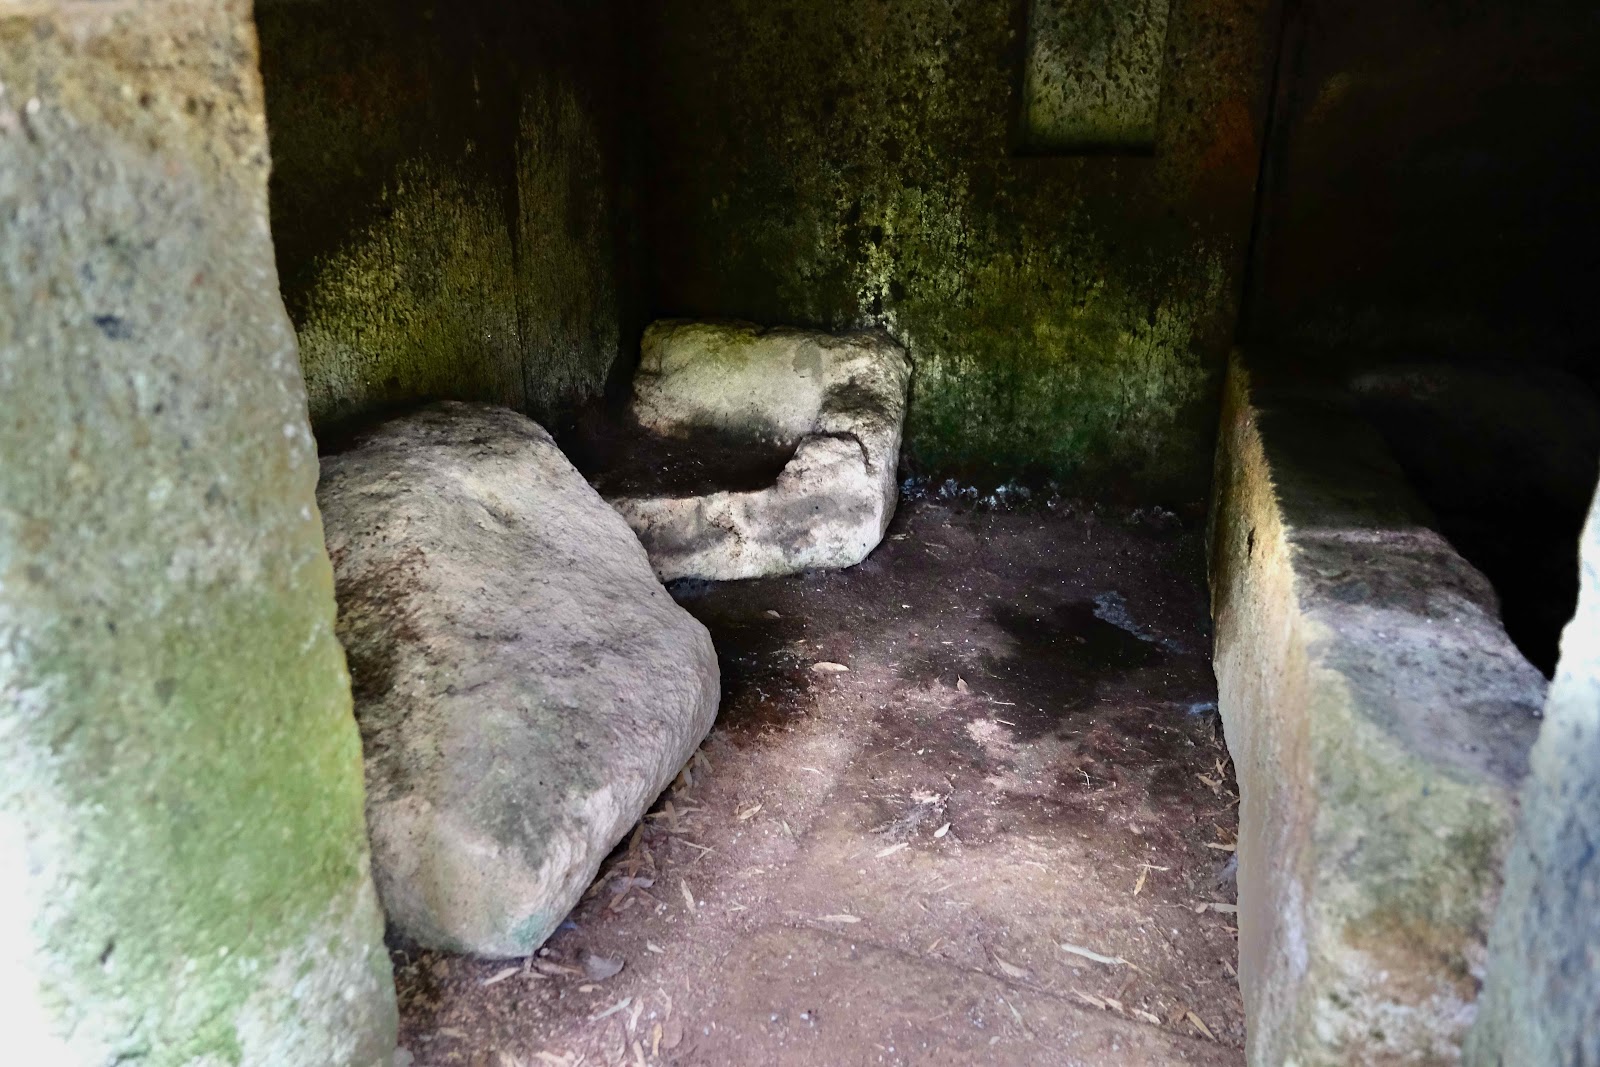
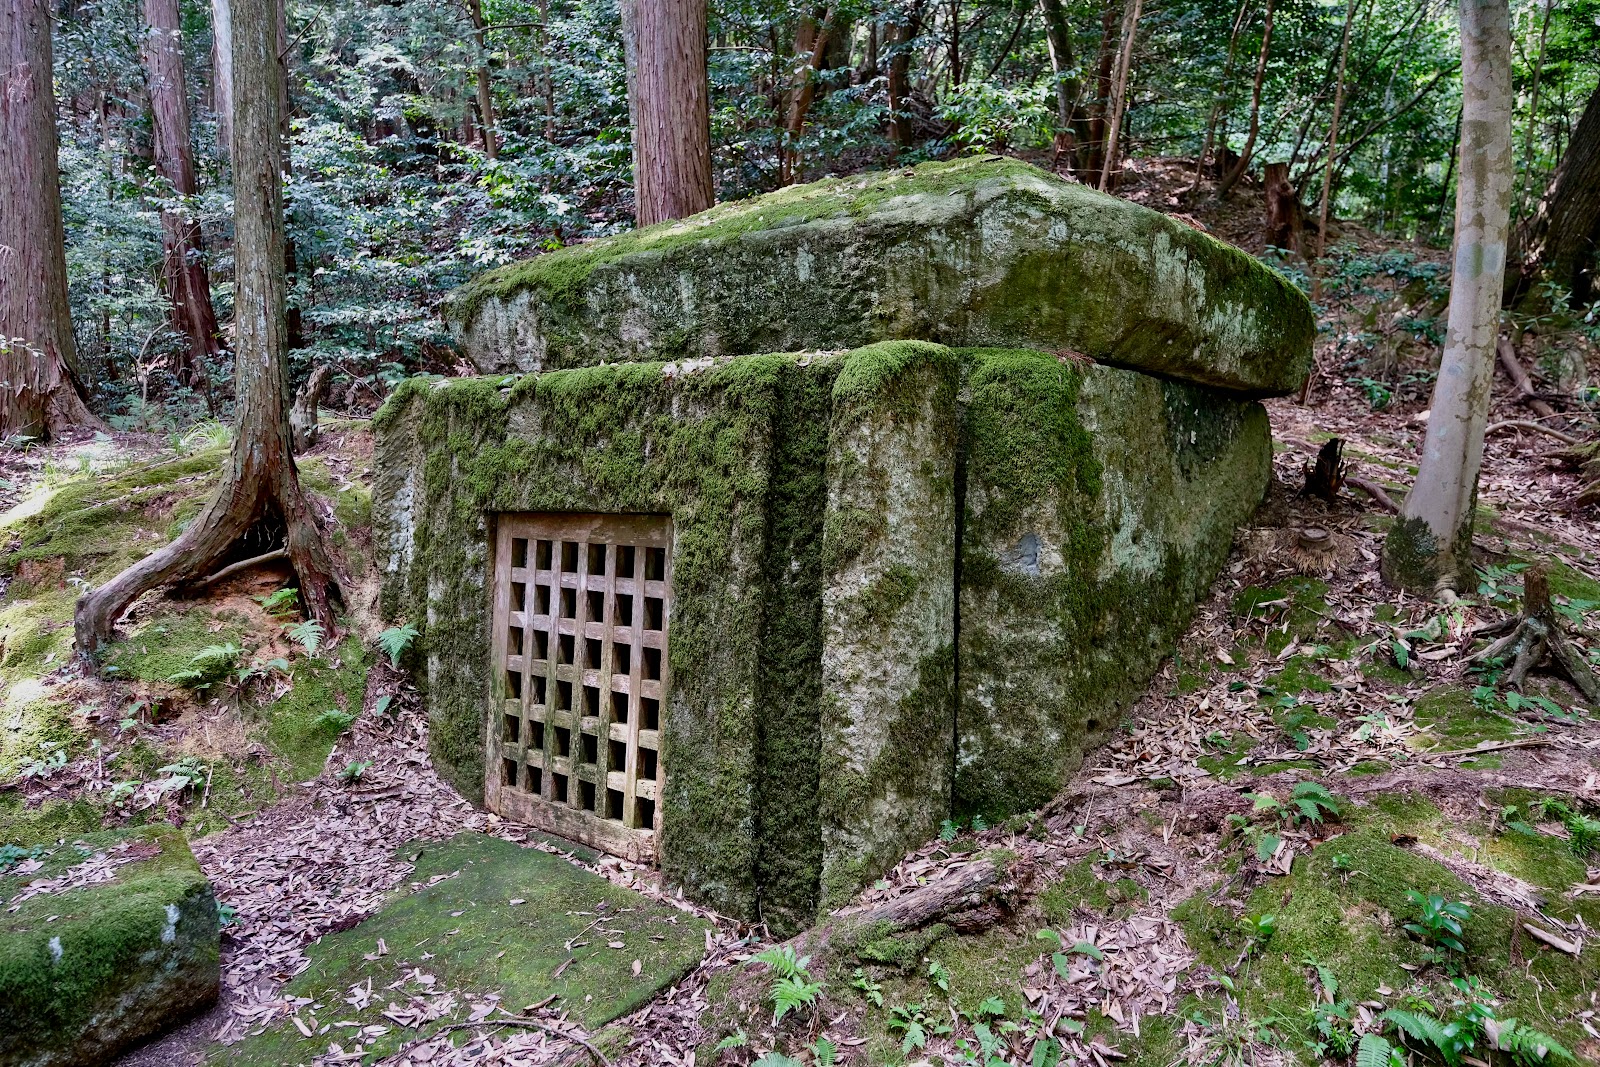
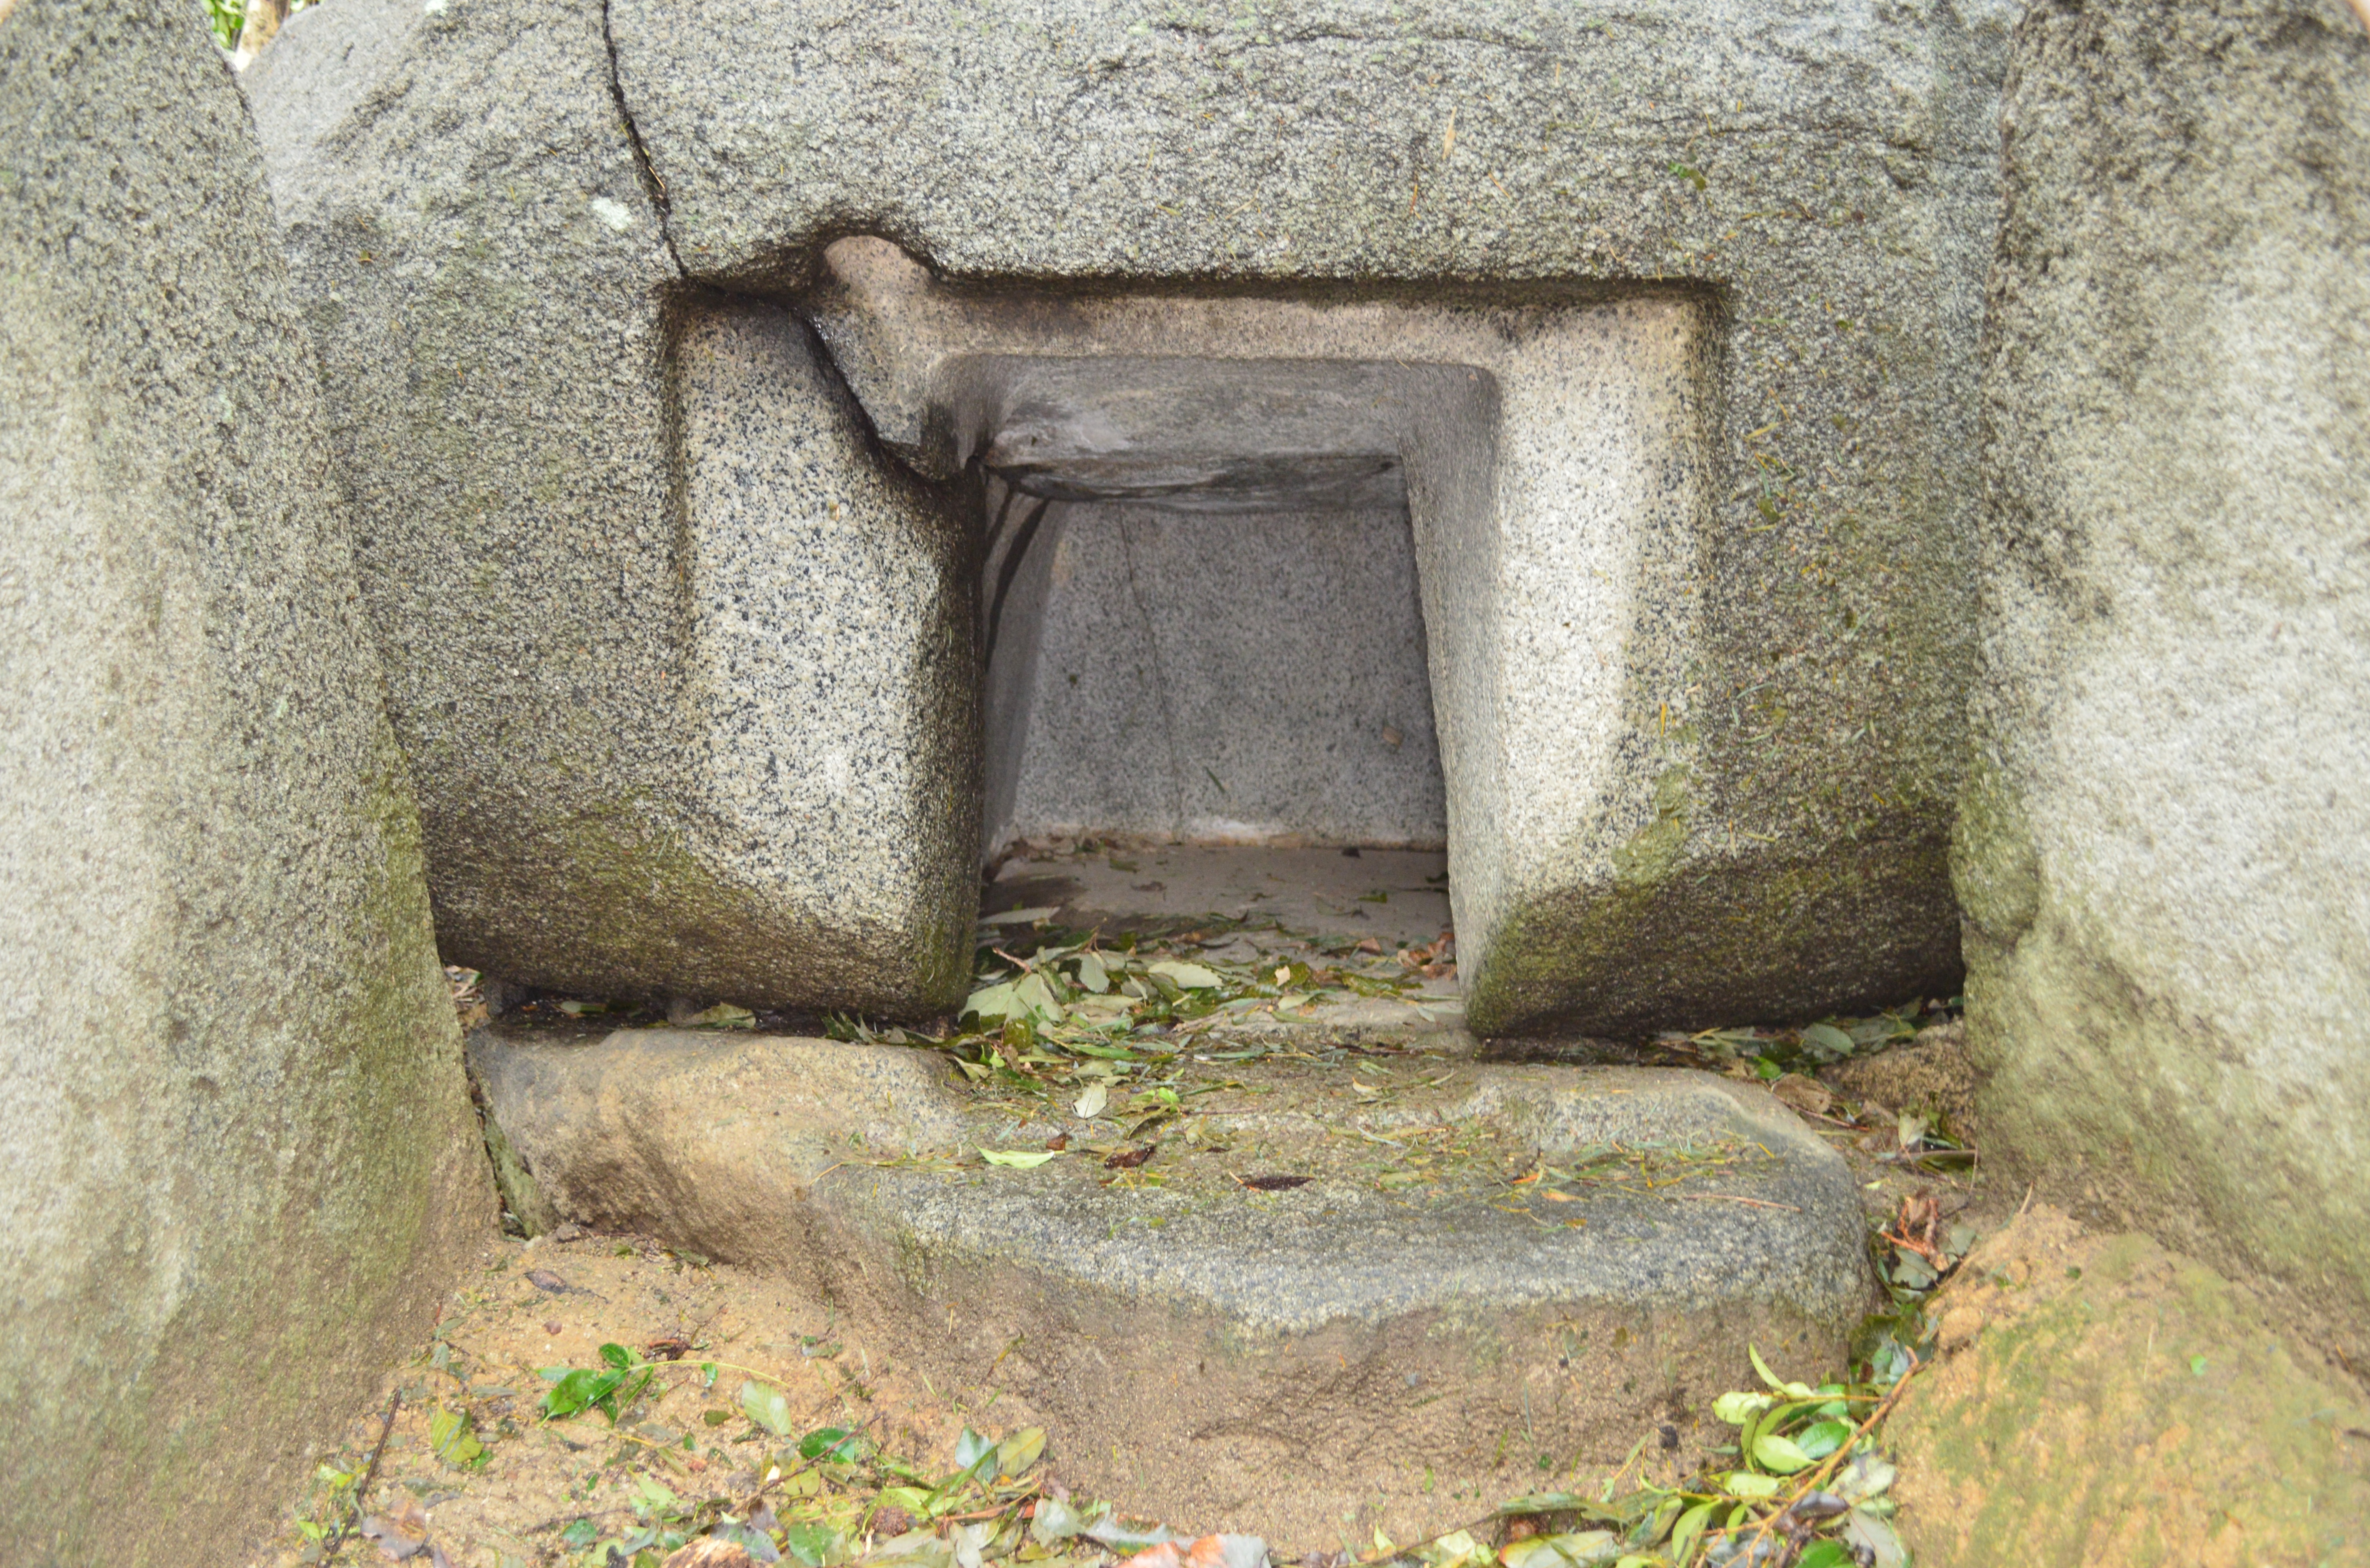
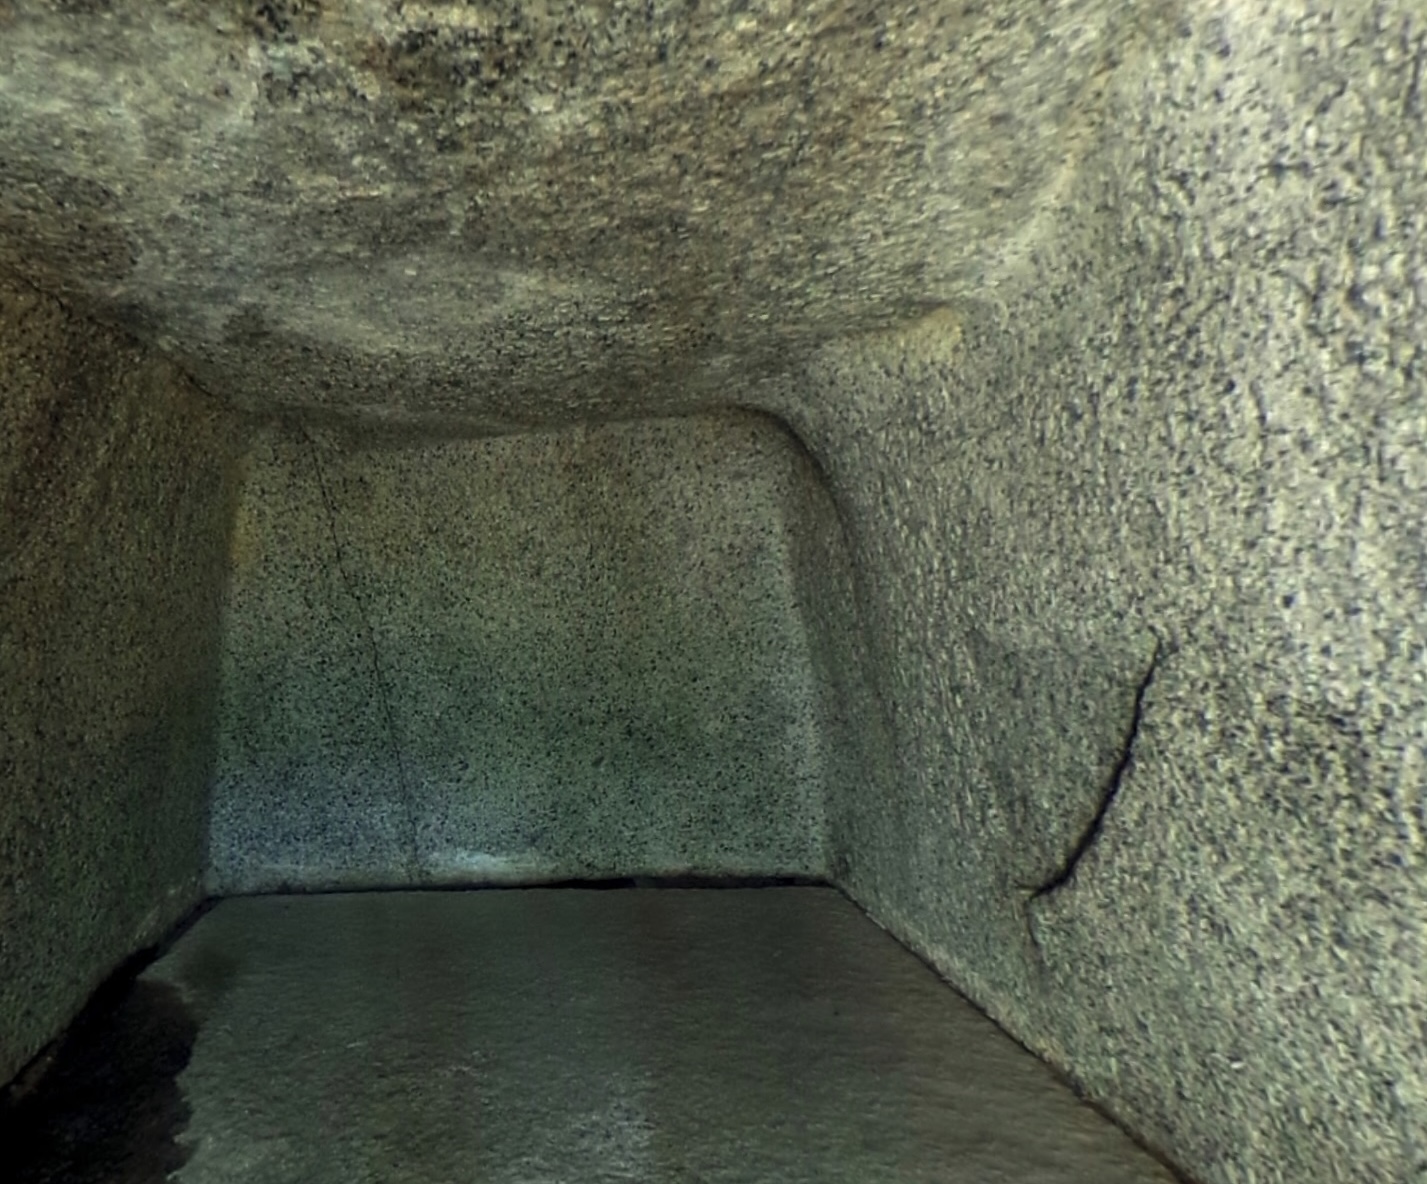
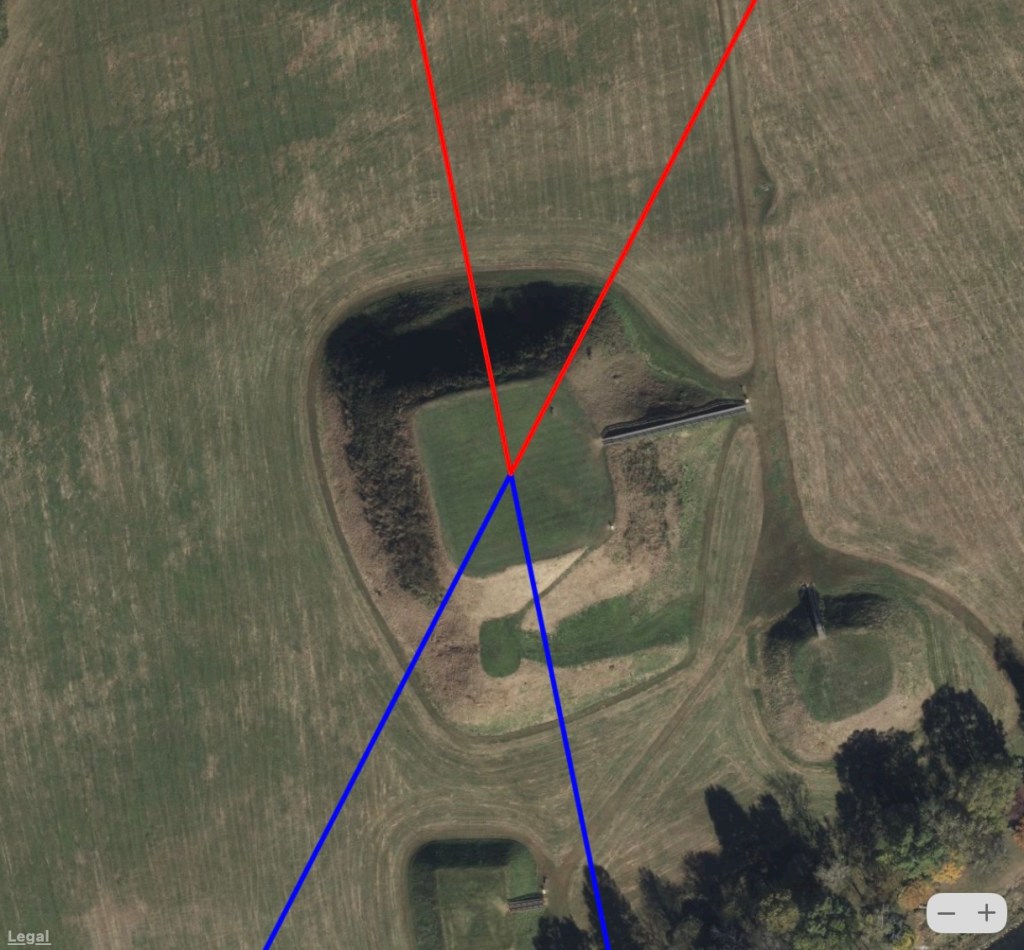
Ishi no Hoden (top left), Iinashi Iwafune Tumulus (middle left) and interior (bottom left). Masuda no Iwafume (bottom right), Ishinohoden Tumulus (middle right) and interior (top right). (Saigen Jiro and others)
Comparing Masuda no Iwafune, Iinashi Iwafune Tumulus, Ishi no Hoden, and Ishinohoden Kofun, counter to expectation, Masuda no Iwafune is similar in material (granite) and stonework to Ishinohoden Kofun, and Ishi no Hoden is similar in material (volcanic tuff) and stonework to Iinashi Iwafune Tumulus. All four structures are conventionally dated to the late Kofun Period. Based on the alignment trends of the Kofun, Shinto/Zen, and Shogunate periods, the cardinal alignments east-west of Masuda no Iwafune and north-south of Ishinohoden Kofun would place them in the Kofun to early Shinto/Zen periods. The same is probably true for the Iinashi Iwafune Tumulus.
Based on its approximate alignment to the Moon, Ishi no Hoden could be dated to the Kofun Period. However, as noted earlier, its alignment to minor lunar standstills is off by a few degrees (Figure 3). That its best alignment would have occurred c. 25,000 BCE suggests the possibility that it could be much older. We present this as a mathematical observation and not a dating proposal as no archaeological evidence currently supports such antiquity in Japan. That said, given the Jomon did not have the know how to cut, shape, and align a stone of such size, if such a claim could be substantiated it would open the possibility that Ishi no Hoden was created by some unknown civilization thousands of years before the Jomon.


_-_4.jpg)