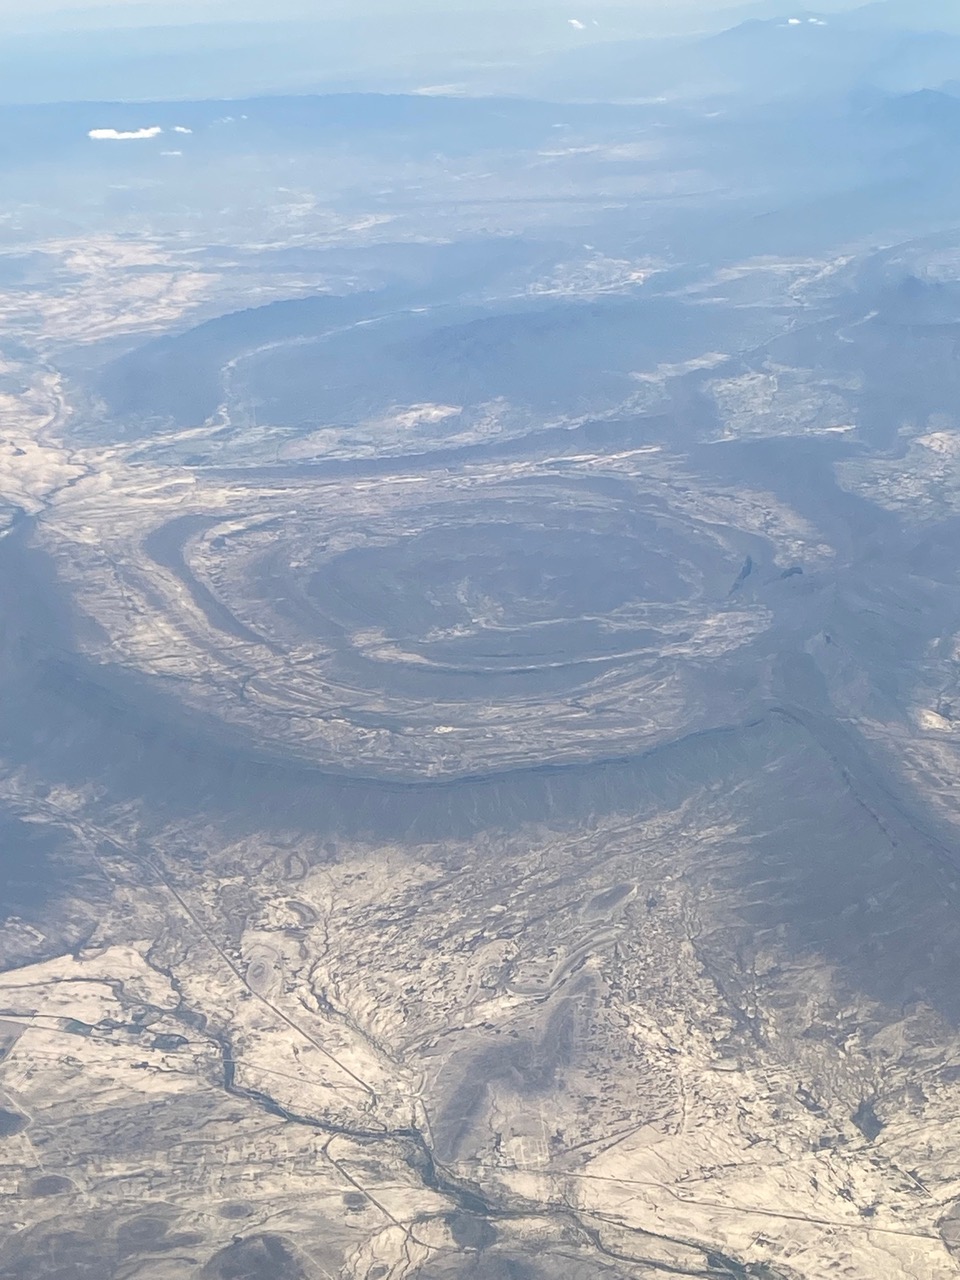
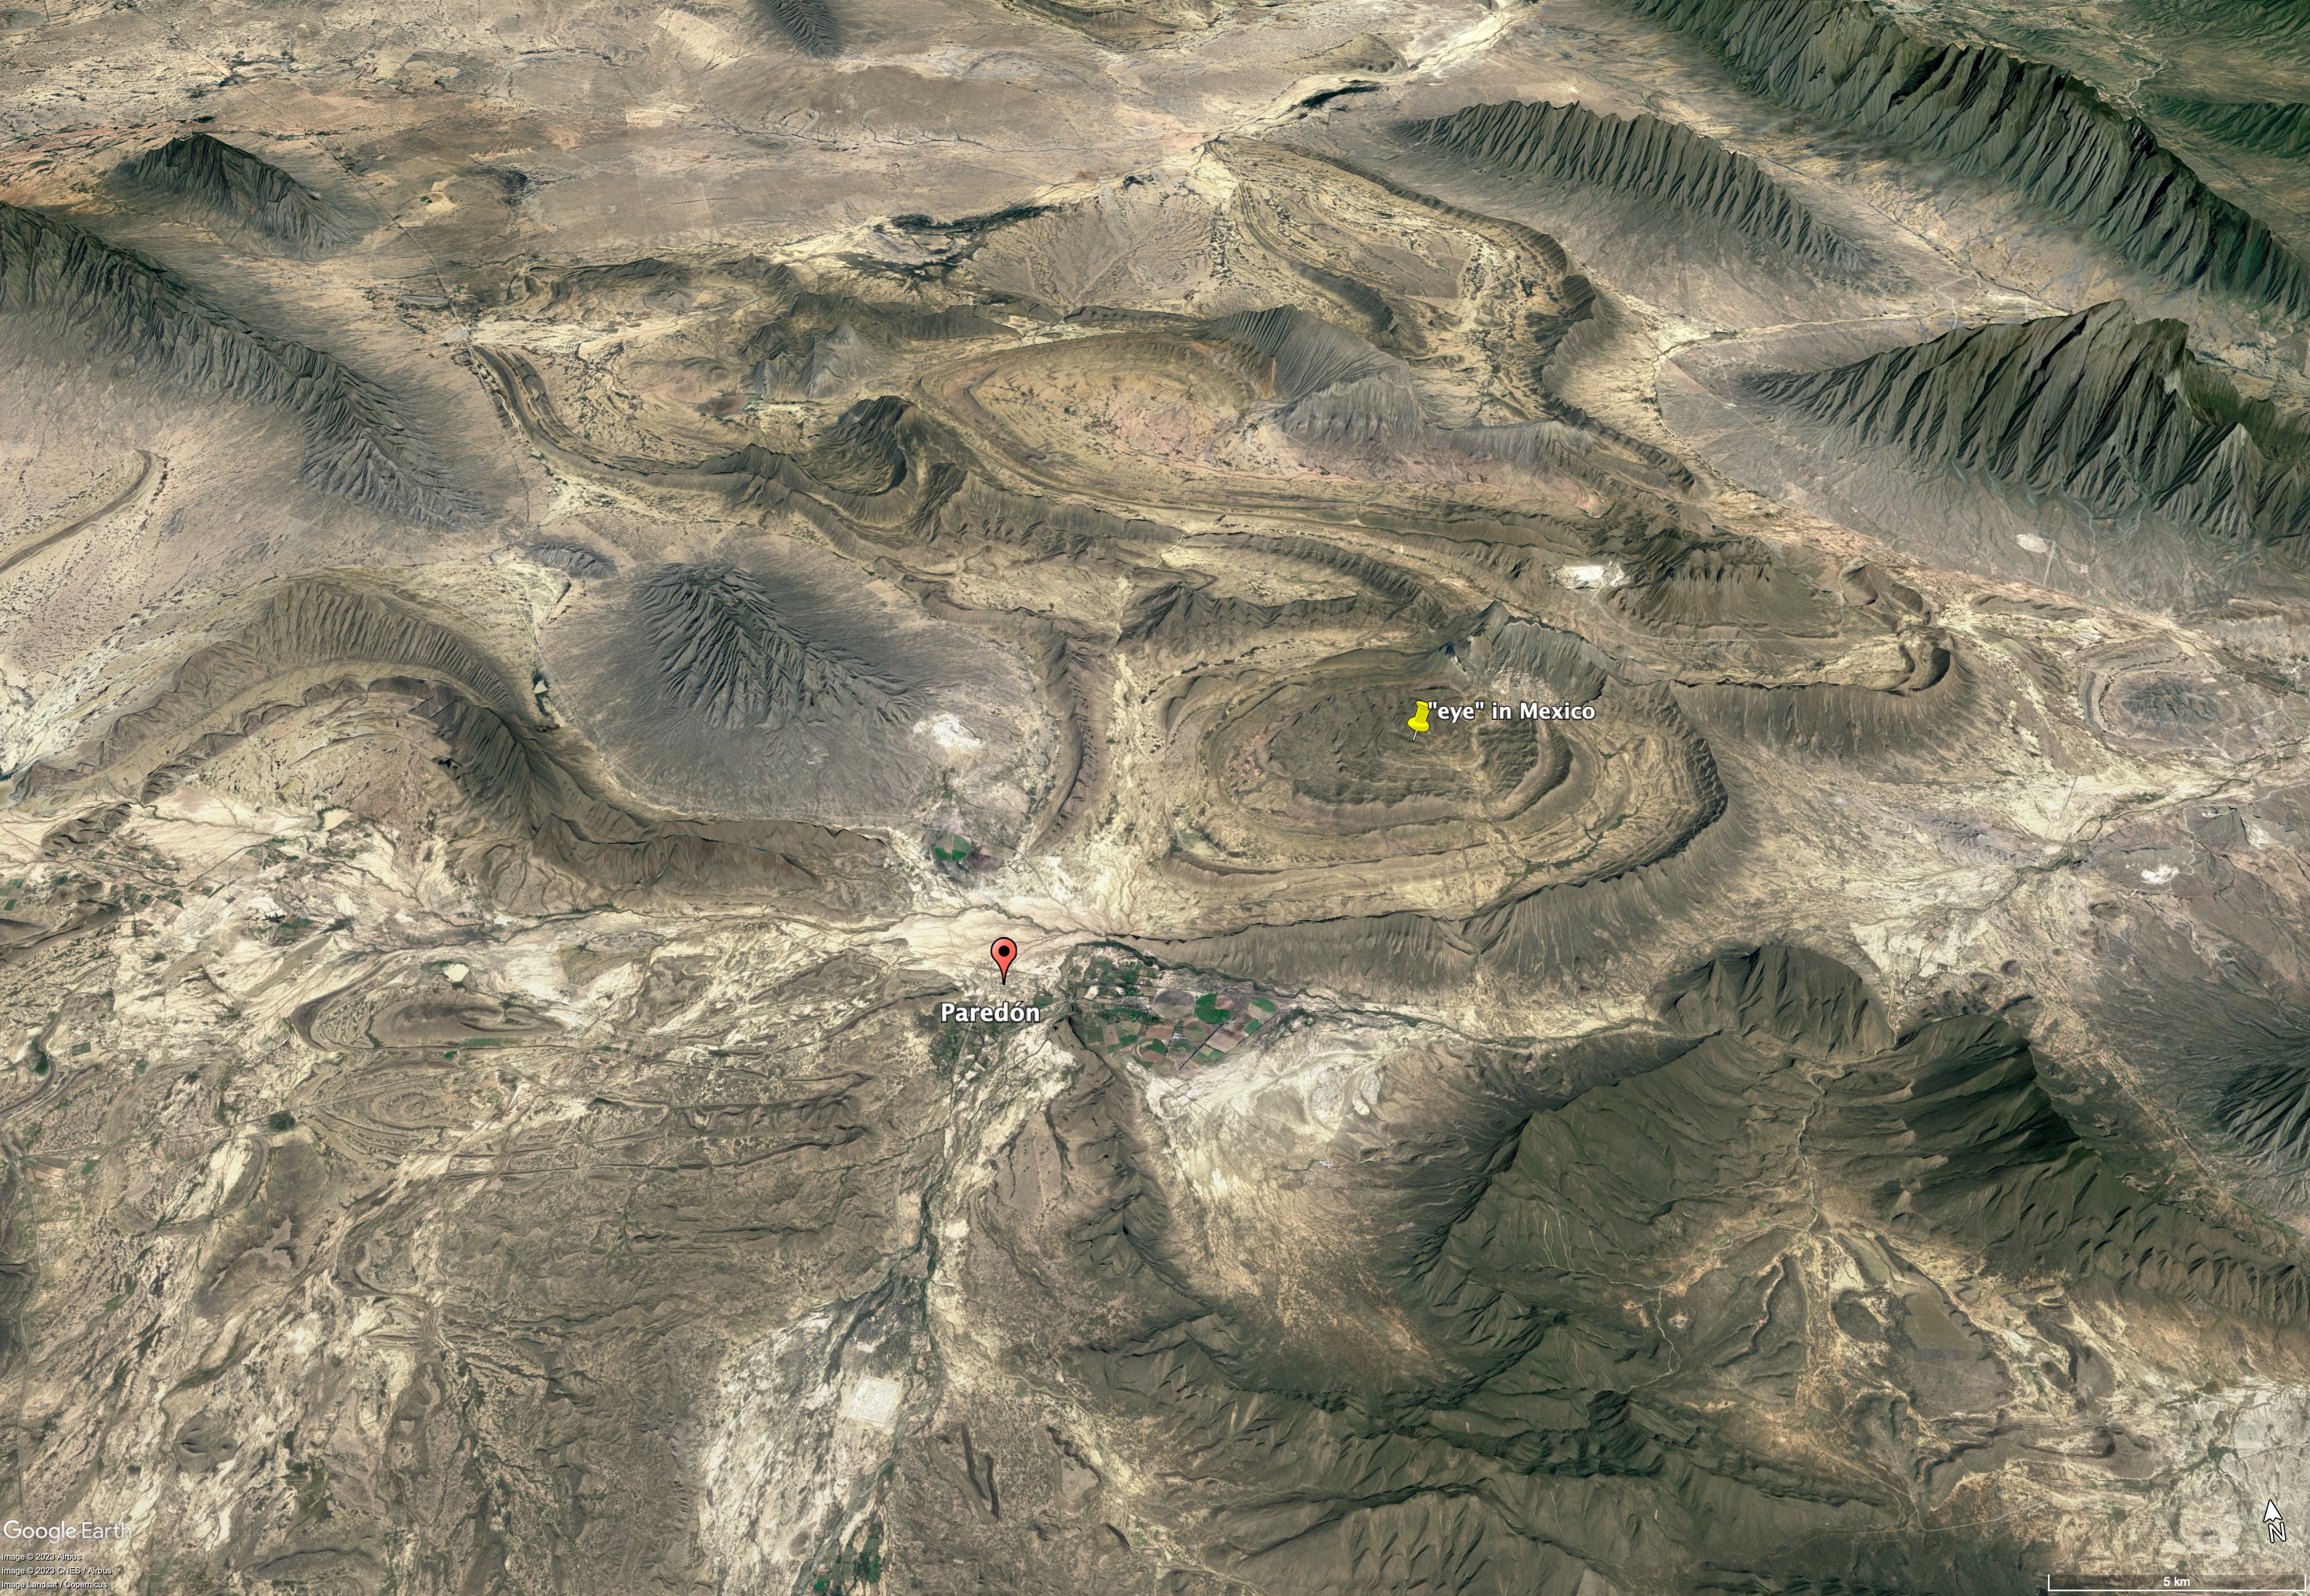
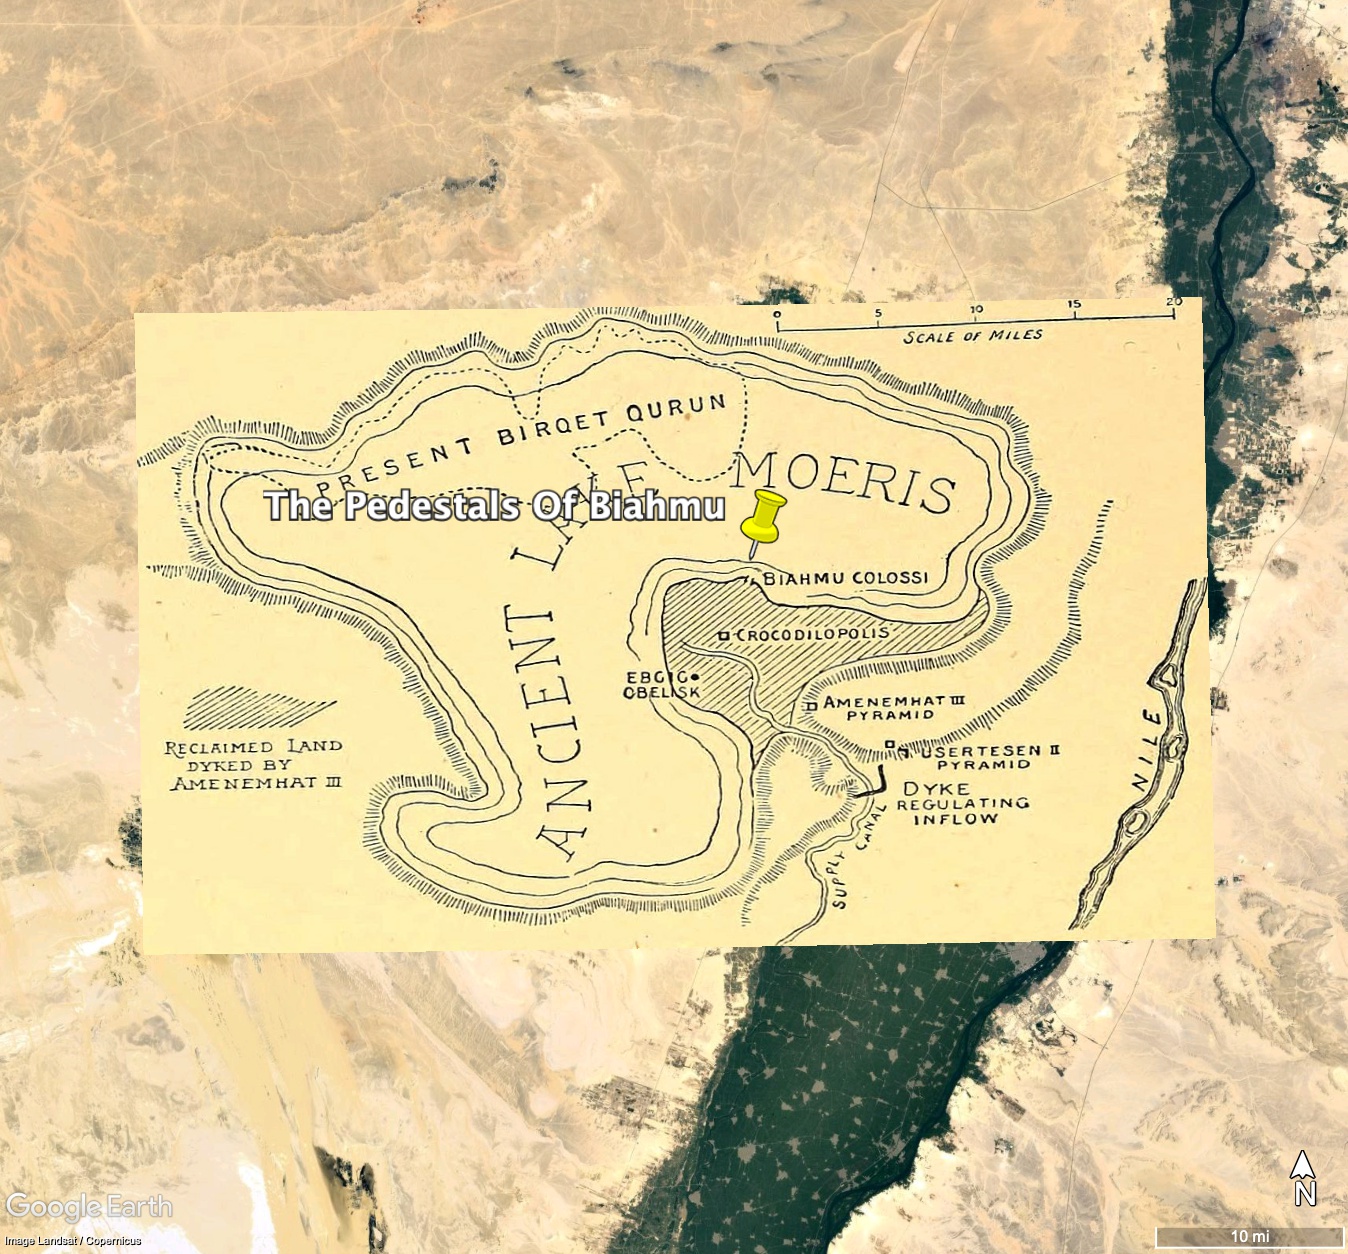
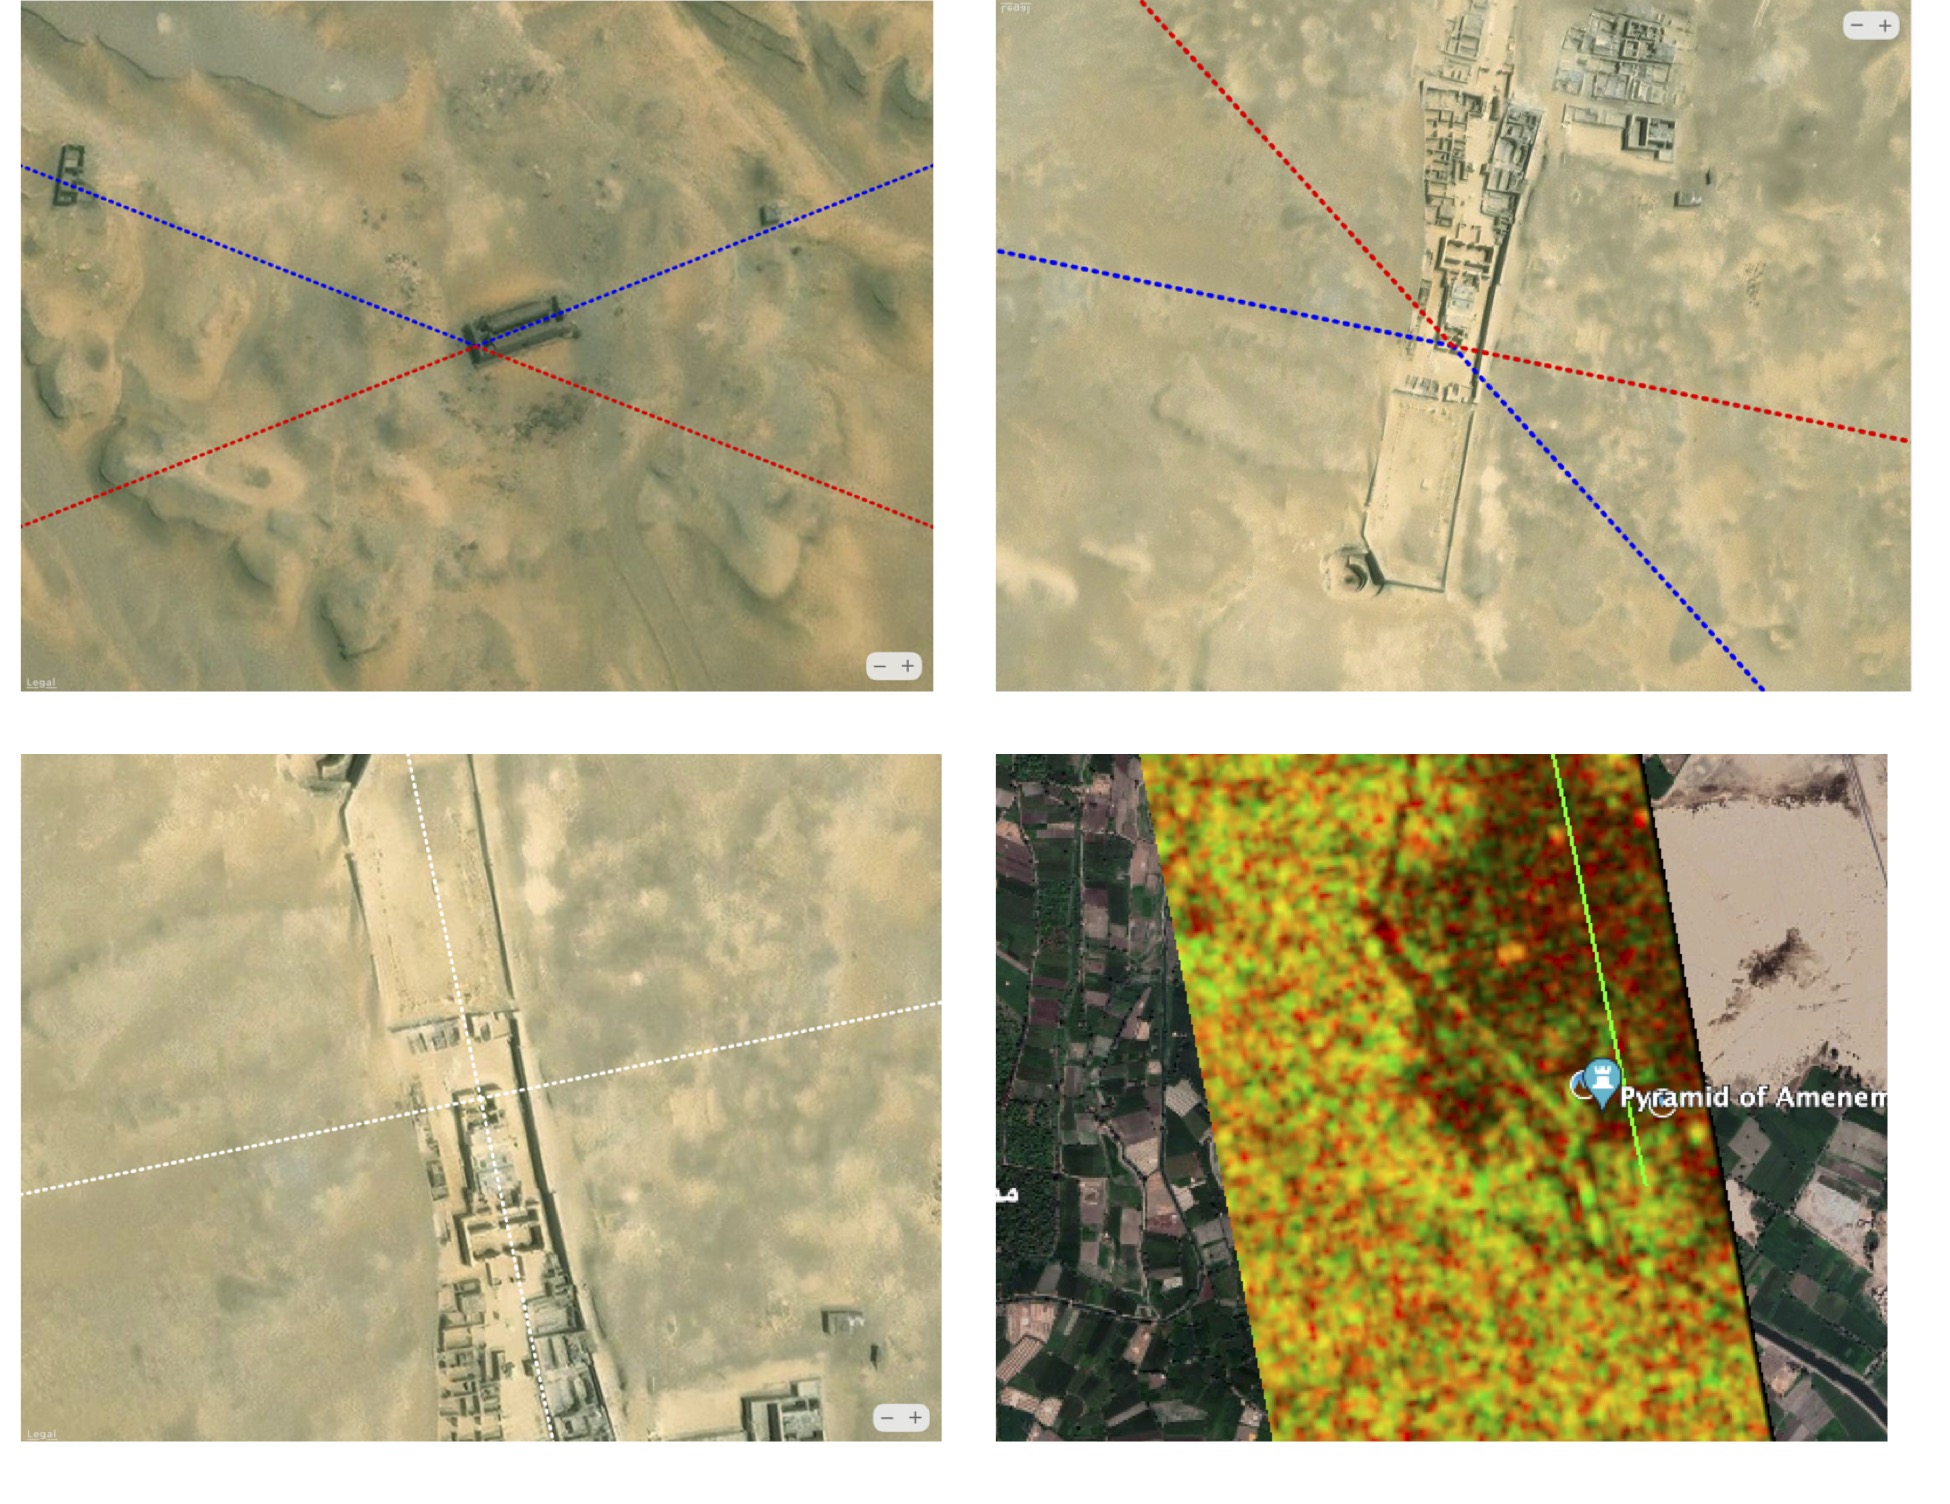
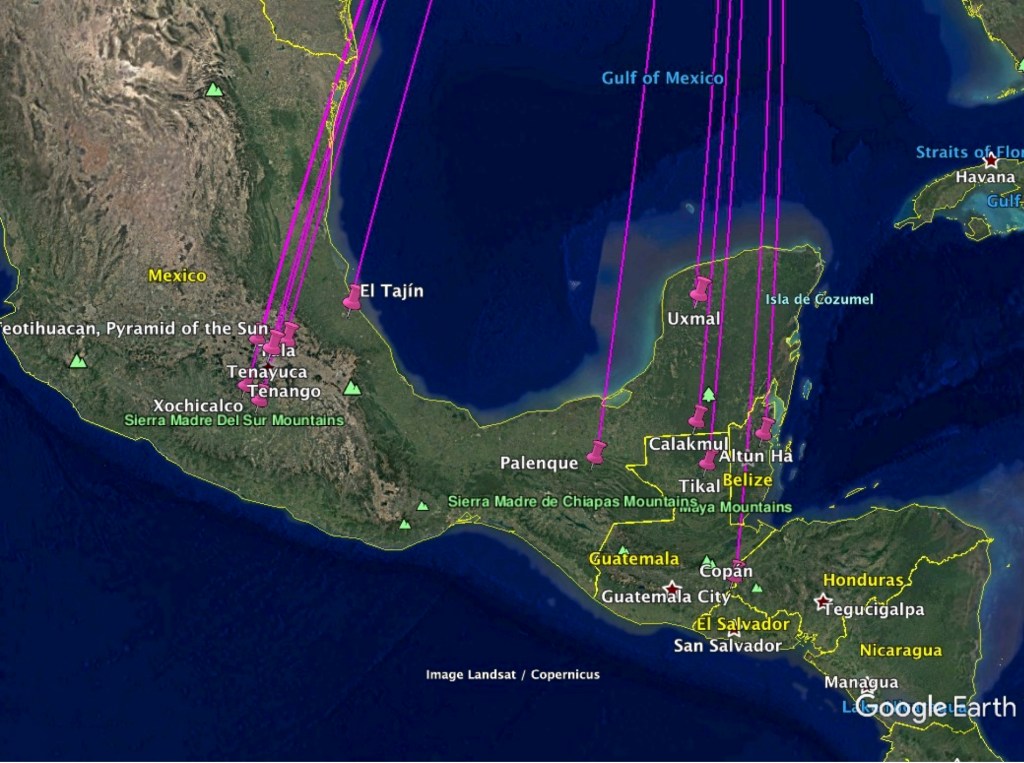
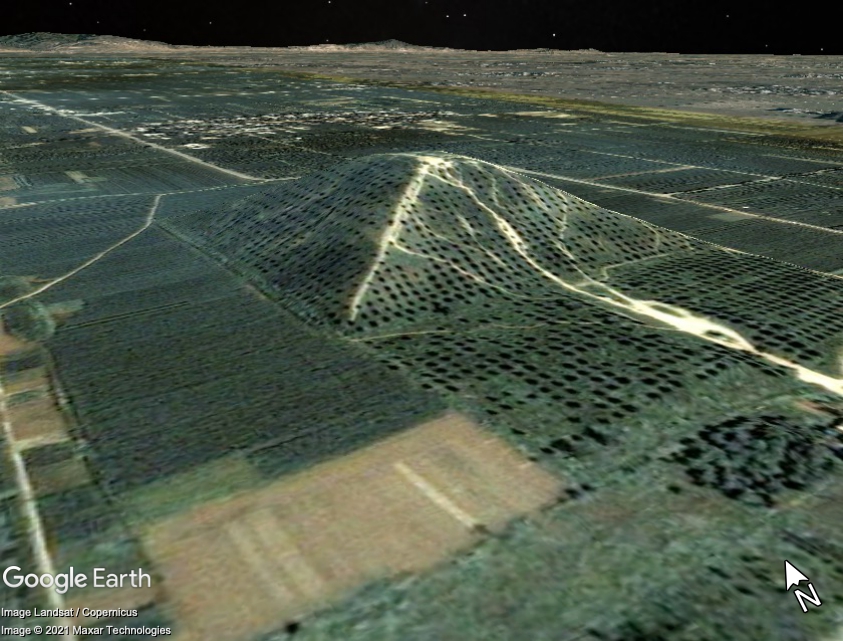
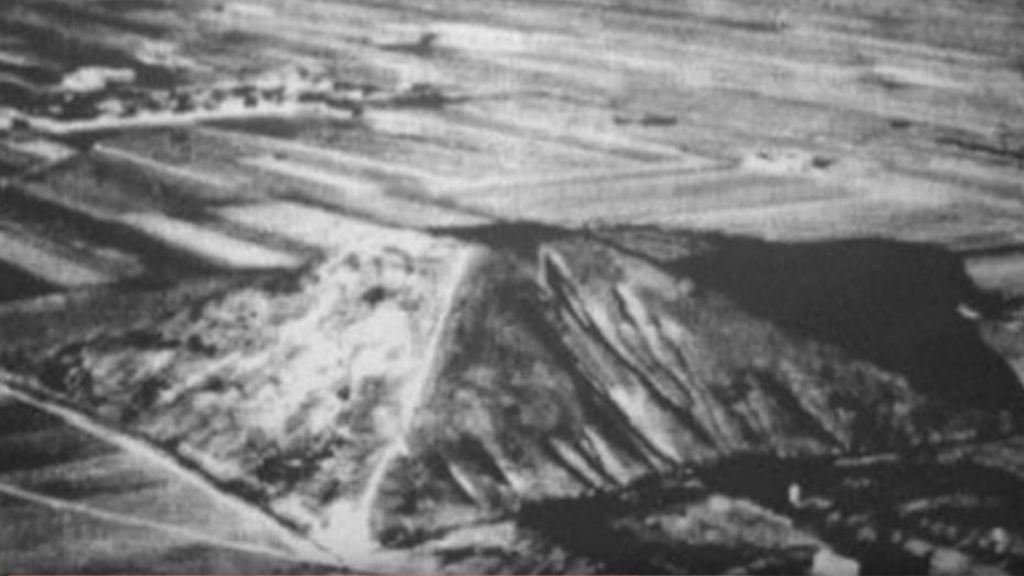
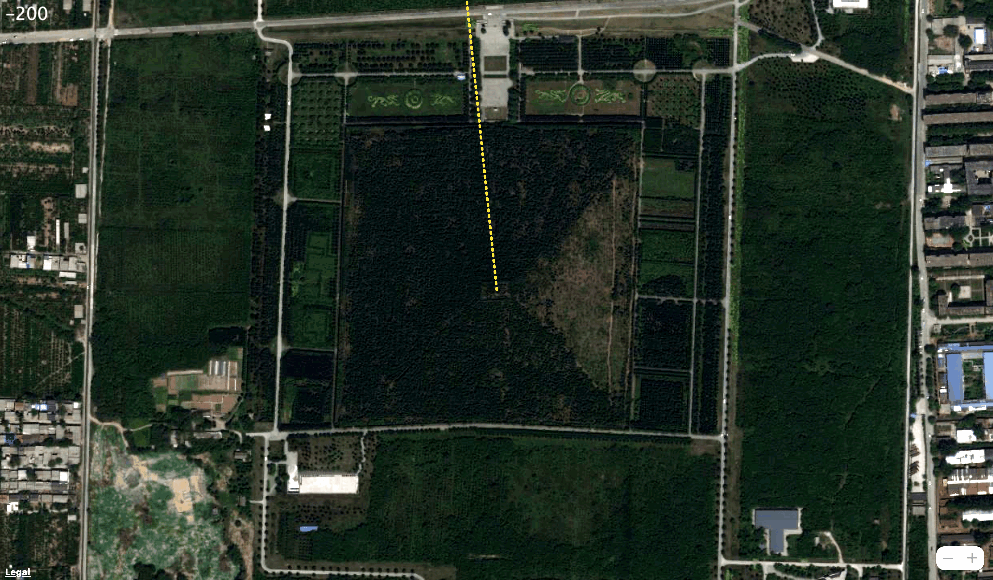
An Ancient City That Was Suddenly Destroyed

The Richat Structure also known as the โ€œeyeโ€ of the Sahara in Mauritania is a deeply eroded geological structure of exposed layers of sedimentary rock that appear as concentric rings. Because of its shape, some believe it to be the remains of Platoโ€™s Atlantis. Scott Sanem contacted me about a similar structure in Paredon located in northeastern Mexico that he has seen many times from the air.ย 

Elephant Remains in Mexico

Wondering if this feature like the Richat Structure could be evidence of a previous civilization in this part of the world, Scott discovered an interesting article in the November and December 1903 issue of The American Antiquarian. The article entitled โ€œElephant Remains in Mexicoโ€ begins with the following introduction:

From the City of Mexico comes a statement bearing the signature of Dr. Nicholas Leon, archaeologist of the National Museum of Mexico. The signature would justify the belief that proper investigation of the facts related has been made. The one great fact is that an ancient city, which was located near the present town of Paredon, in the state of Coahuila, some 500 miles north of the City of Mexico, was suddenly destroyed in some past age by an overflow of water and mud, and that its remains are still existent on the spot. Many massive walls have been found, but they are covered with a mass of deposited earth, sixty feet in thickness. And mingled in this earth are human skeletons, the tusks of elephants, etc., distributed in a way which indicates that the overflow of water and mud was sudden, giving no time for escape.

Dr. Leon, who was one of the most respected archaeologists in Mexico at this time, joined the National Museum in Mexico City in 1900 and became head of the Department of Anthropology. The article continues:

The account which has fallen under our notice is somewhat brief. We cannot vouch for its accuracy, and simply present the report:

Portions of buildings, so far unearthed, show that the city โ€” at least the largest of the cities were covered by the debris of the flood, there being at least three cities destroyedโ€” was very extensive. The indications are that there were many massive structures in the fallen city, and that they were of a class of architecture not to be found elsewhere in Mexico. According to the estimates of the scientists under whose directions the excavations are now being made, the city in question had a population of at least 50,000.

The destruction which was brought by the flood was complete. All the inhabitants of the cities were killed, as well as all the animals. Skeletons of the human inhabitants of the cities and of the animals are strewn all through the debris, from a depth of three feet from the surface to a depth of sixty feet, showing that all the debris was deposited almost at once. Measurements show that the debris is on an average, sixty feet-deep where the largest of the cities stood.

Most remarkable of the minor finds that have been made at Paredon is that of the remains of elephants. Never before in the history of Mexico has it been ascertained positively that elephants were ever in the service of the ancient inhabitants. The remains of the elephants that have been found at Paredon show plainly that the inhabitants of the buried cities made elephants work for them. Elephants were as much in evidence in the cities as horses. Upon many of the tusks that have been found were rings of silver. Most of the tusks encountered so far have an average length, for grown elephants, of three feet, and an average diameter at the roots of six inches. Judging from the remains of the elephants so far unearthed, the animals were about ten feet in height and sixteen to eighteen feet in length, differing very little from those at present in existence.

Several editorial comments follow that leave with reader with some doubt about the credibility of Dr. Leon’s report:

Now, these statements in reference to the elephantsโ€™ bones found among the ruined cities need confirmation, before they are accepted by the majority of archaeologists. It is true that the tusks and bones of mastodons are frequently found in the swamps of Michigan, Ohio, and Indiana, but they are supposed to belong to the same species which are found in the frozen mud of Siberia and the gravels of the Northwest coast. A species covered with hair and adapted to the cold climate, and quite different from any-that would be found as far south as Mexico. The circumpolar regions are full of these creatures, which have perished, but their bodies have been preserved in the ice-beds. Other animals, such as the buffalo and bison, have over run portions of this continent, since the days of the mastodon, but none of them reached as far south as Mexico.

Mammoth remains unearthed near Mexico City in 2020. Image courtesy Mexico News Daily.

An Ice Age Civilization in Northeastern Mexico?

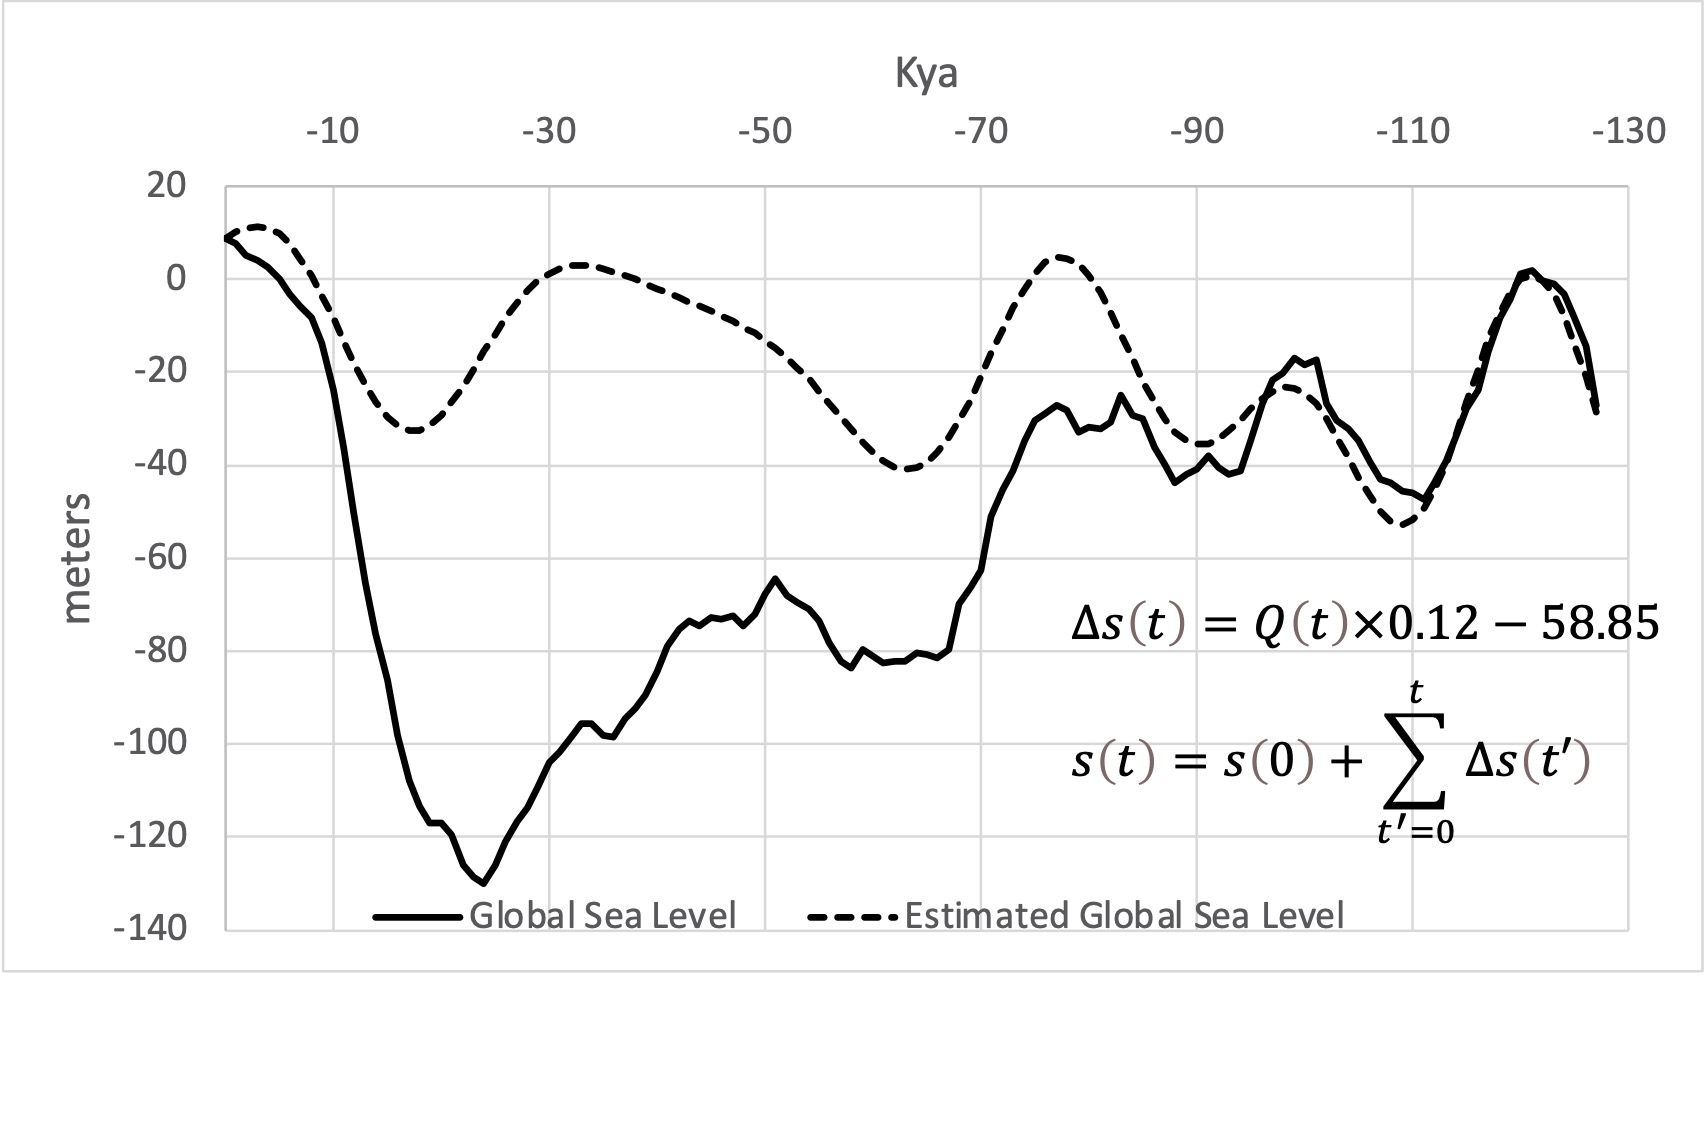
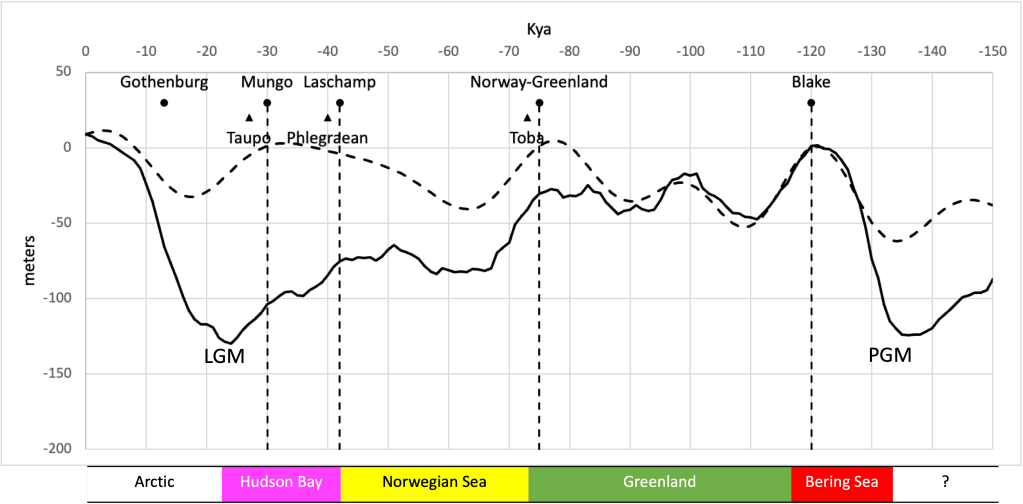
The discovery of hundreds of mammoth skeletons recovered at an airport construction site north of Mexico City in 2020 suggests the bones unearthed by Dr. Leon were not those of elephants but of mammoths. As we saw in the previous article, if we accept the possibility of crustal displacements as a working hypothesis, according to Hapgoodโ€™s theory, if the North Pole were in Hudson Bay during the North American ice age, most of the places mammoth remains have been found would have been in the temperate zone relative to the former pole. That region, which is known as the Mammoth Steppe stretches from the Iberian Peninsula in western Europe, across Eurasia, through Beringia, and into North America. The discovery of mammoth remains near Mexico City suggests this region extended into Northern Mexico.ย 

The continuation of the Mammoth Steppe into Mexico is in the temperate zone (green line) relative to the Hudson Bay Pole. (Click to enlarge)

The bones found at โ€œMammoth Centralโ€ near Mexico City are estimated to be 10,000 to 20,000 years old. If the elephant remains found by Dr. Leon were those of mammoths, then this portion of his report becomes extremely interesting:

The one great fact is that an ancient city, which was located near the present town of Paredon, in the state of Coahuila, some 500 miles north of the City of Mexico, was suddenly destroyed in some past age by an overflow of water and mud, and that its remains are still existent on the spot. Many massive walls have been found, but they are covered with a mass of deposited earth, sixty feet in thickness. And mingled in this earth are human skeletons, the tusks of elephants, etc., distributed in a way which indicates that the overflow of water and mud was sudden, giving no time for escape.

Google Earth image showing the location of “eye” and the city of Paredon in northeastern Mexico. (Click to enlarge)

Geological Evidence of a Crustal Displacement?

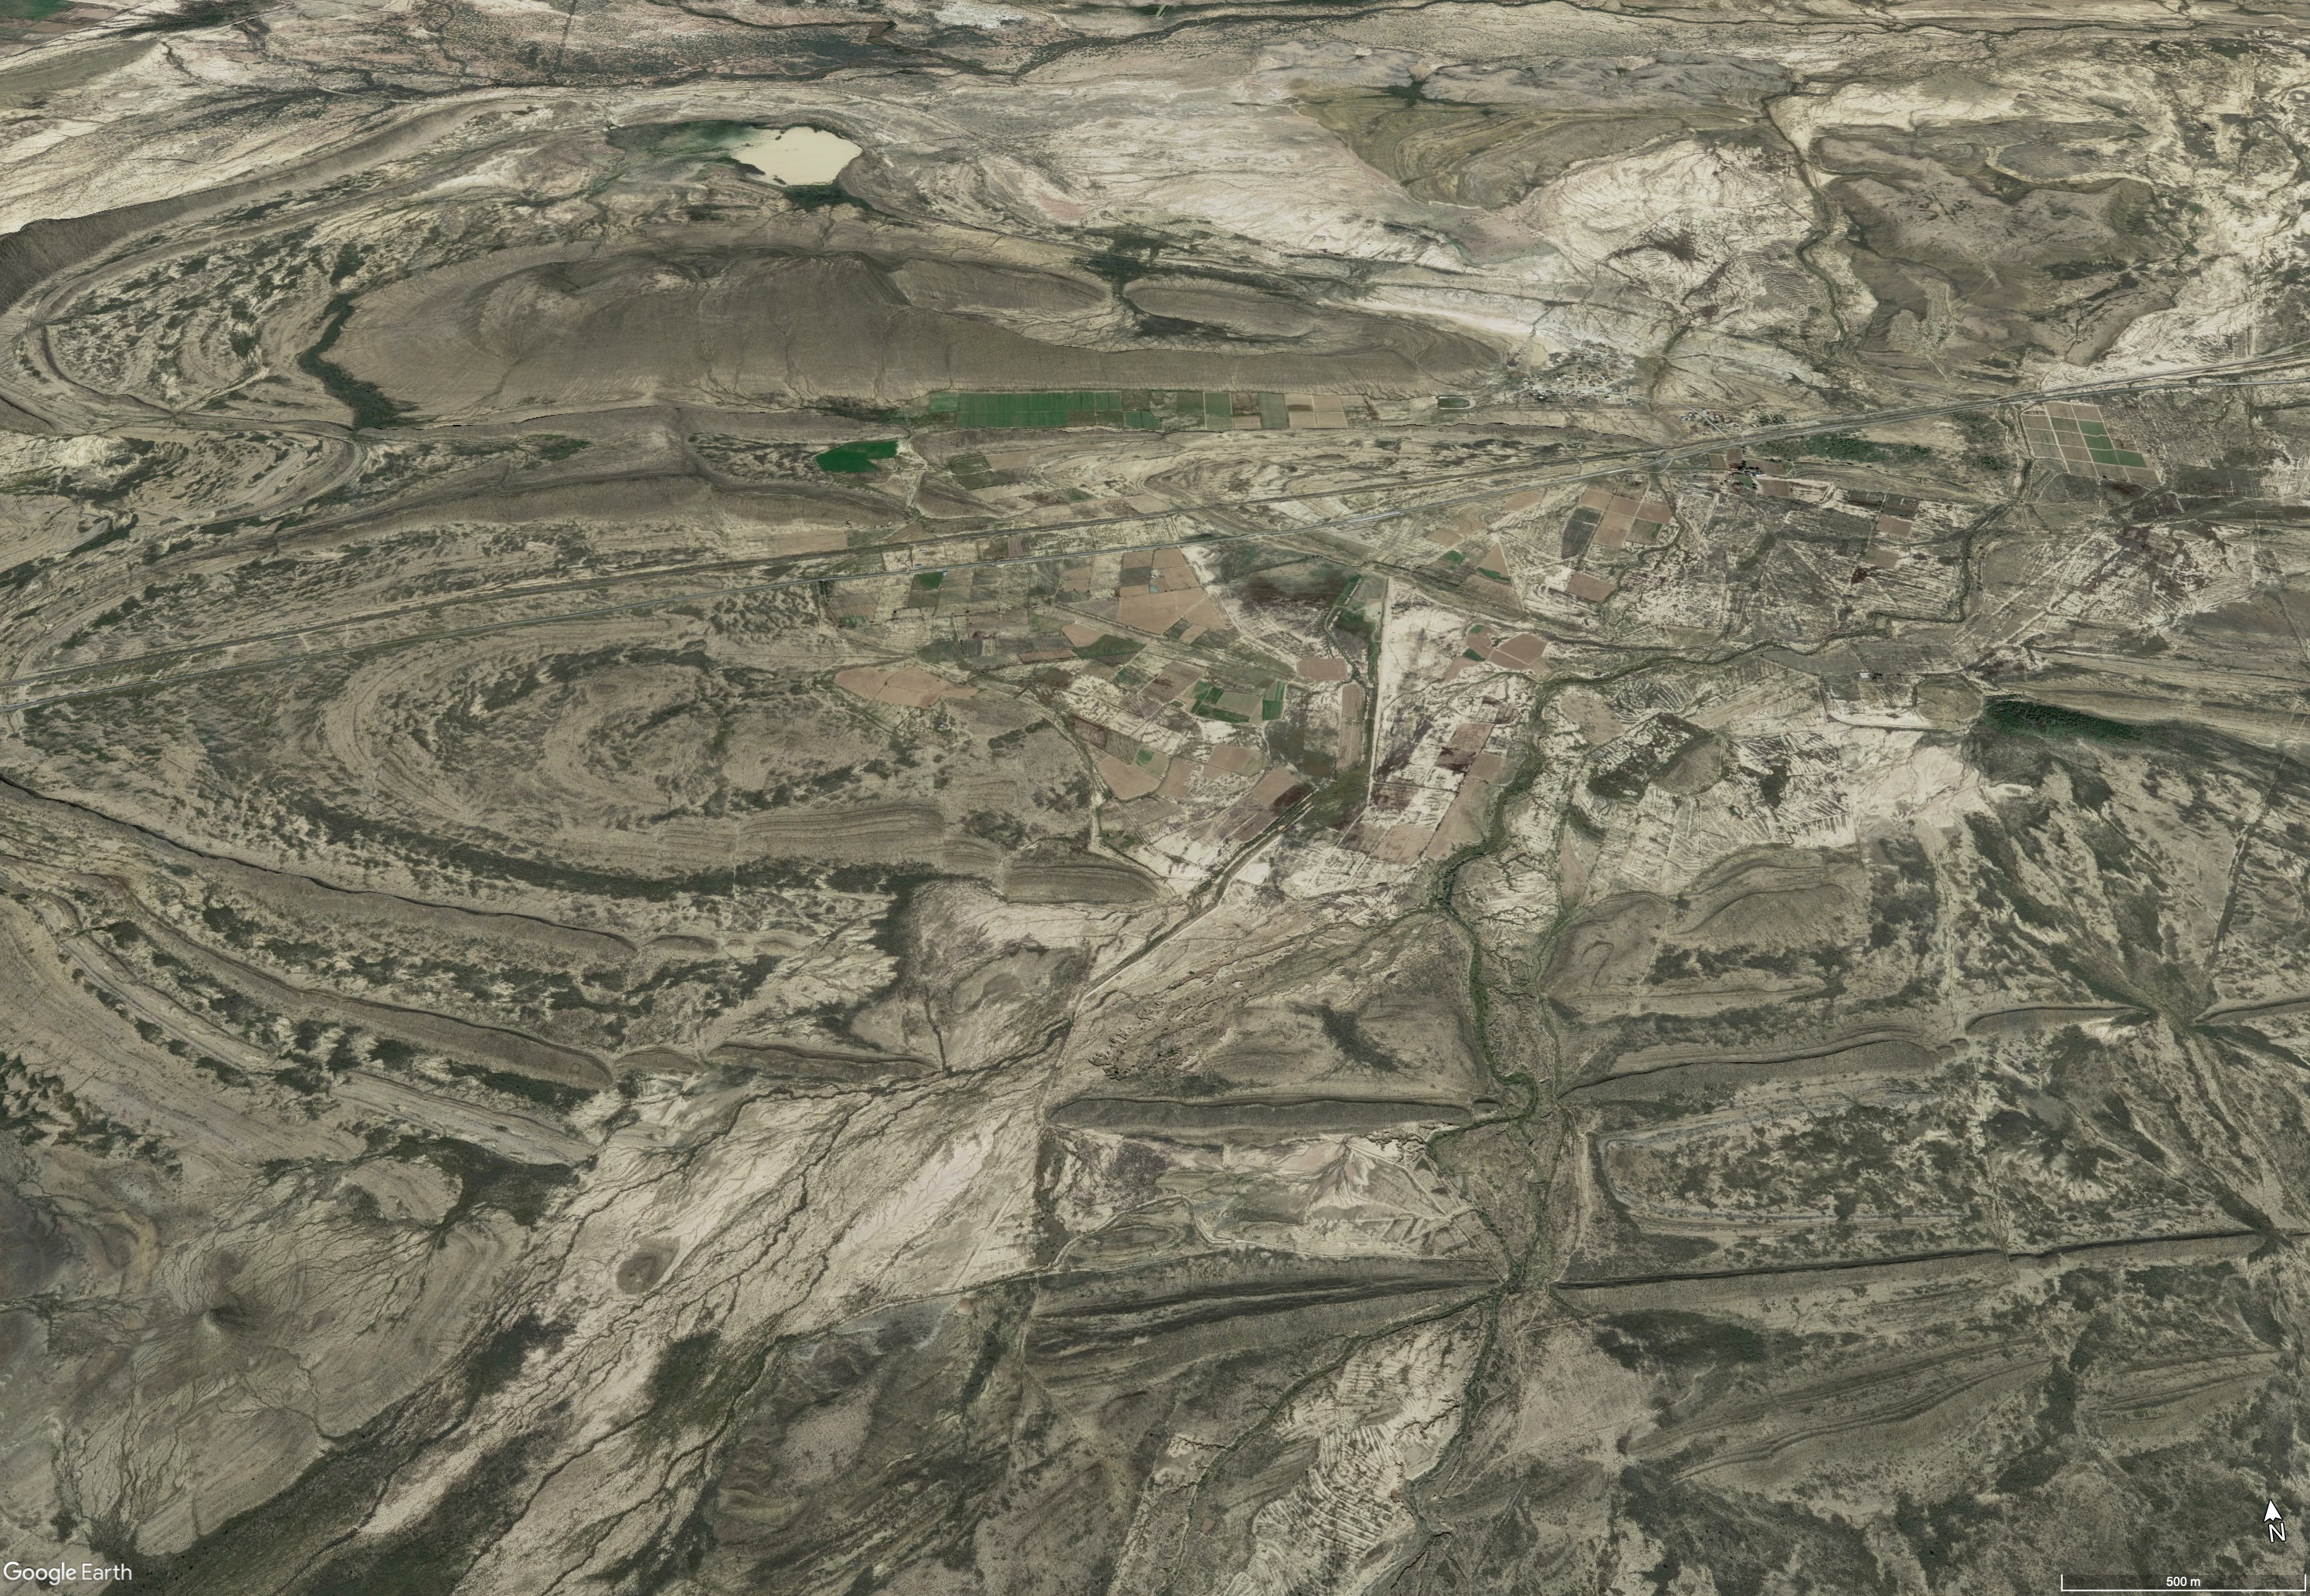
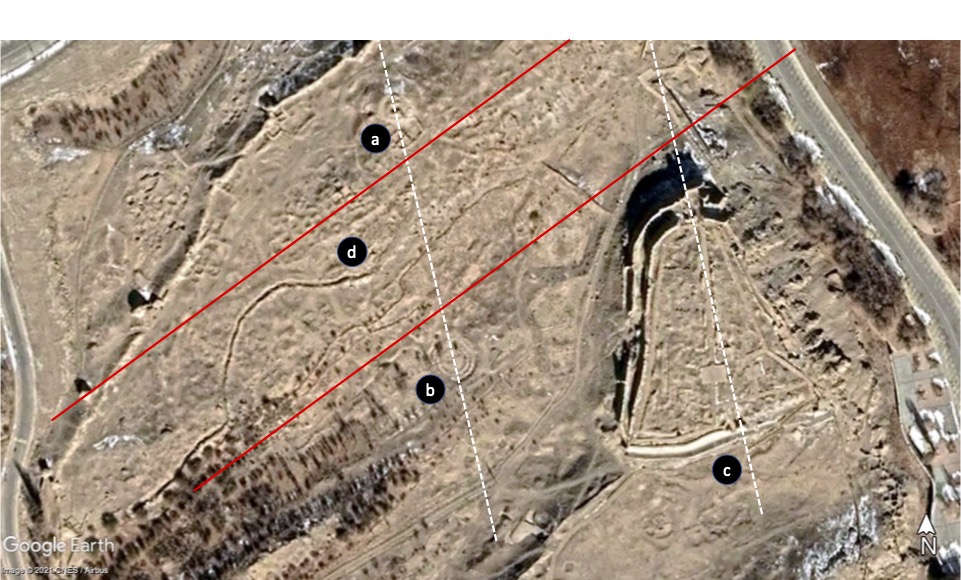
The Richat Structure is thought to be a kind of symmetrical uplift feature known as a dome, probably volcanic in origin. Where the Richat Structure is an isolated formation in the Sahara, the โ€œeyeโ€ of Mexico, exists along with other similar features in a region that lies between the mountains to the west and the coastal plain to the east. 

Although it is not itself an impact feature, domes can sometimes be found near impact craters. Besides volcanism, domes can also form as the result of a process known as diapirism in which less dense materials rise to the surface, and from horizontal stresses resulting in the formation of a system of basins and domes, a process known as refolding.

Temperate zones: current (top green line) and Hudson Bay (bottom green line). Maximum crustal displacement was south to north from the former Hudson Bay pole to the current location of the North Pole in the Arctic Ocean (along the blue line). Paredon is the red placemark approximately 1400 miles west of this line. (Click to enlarge)

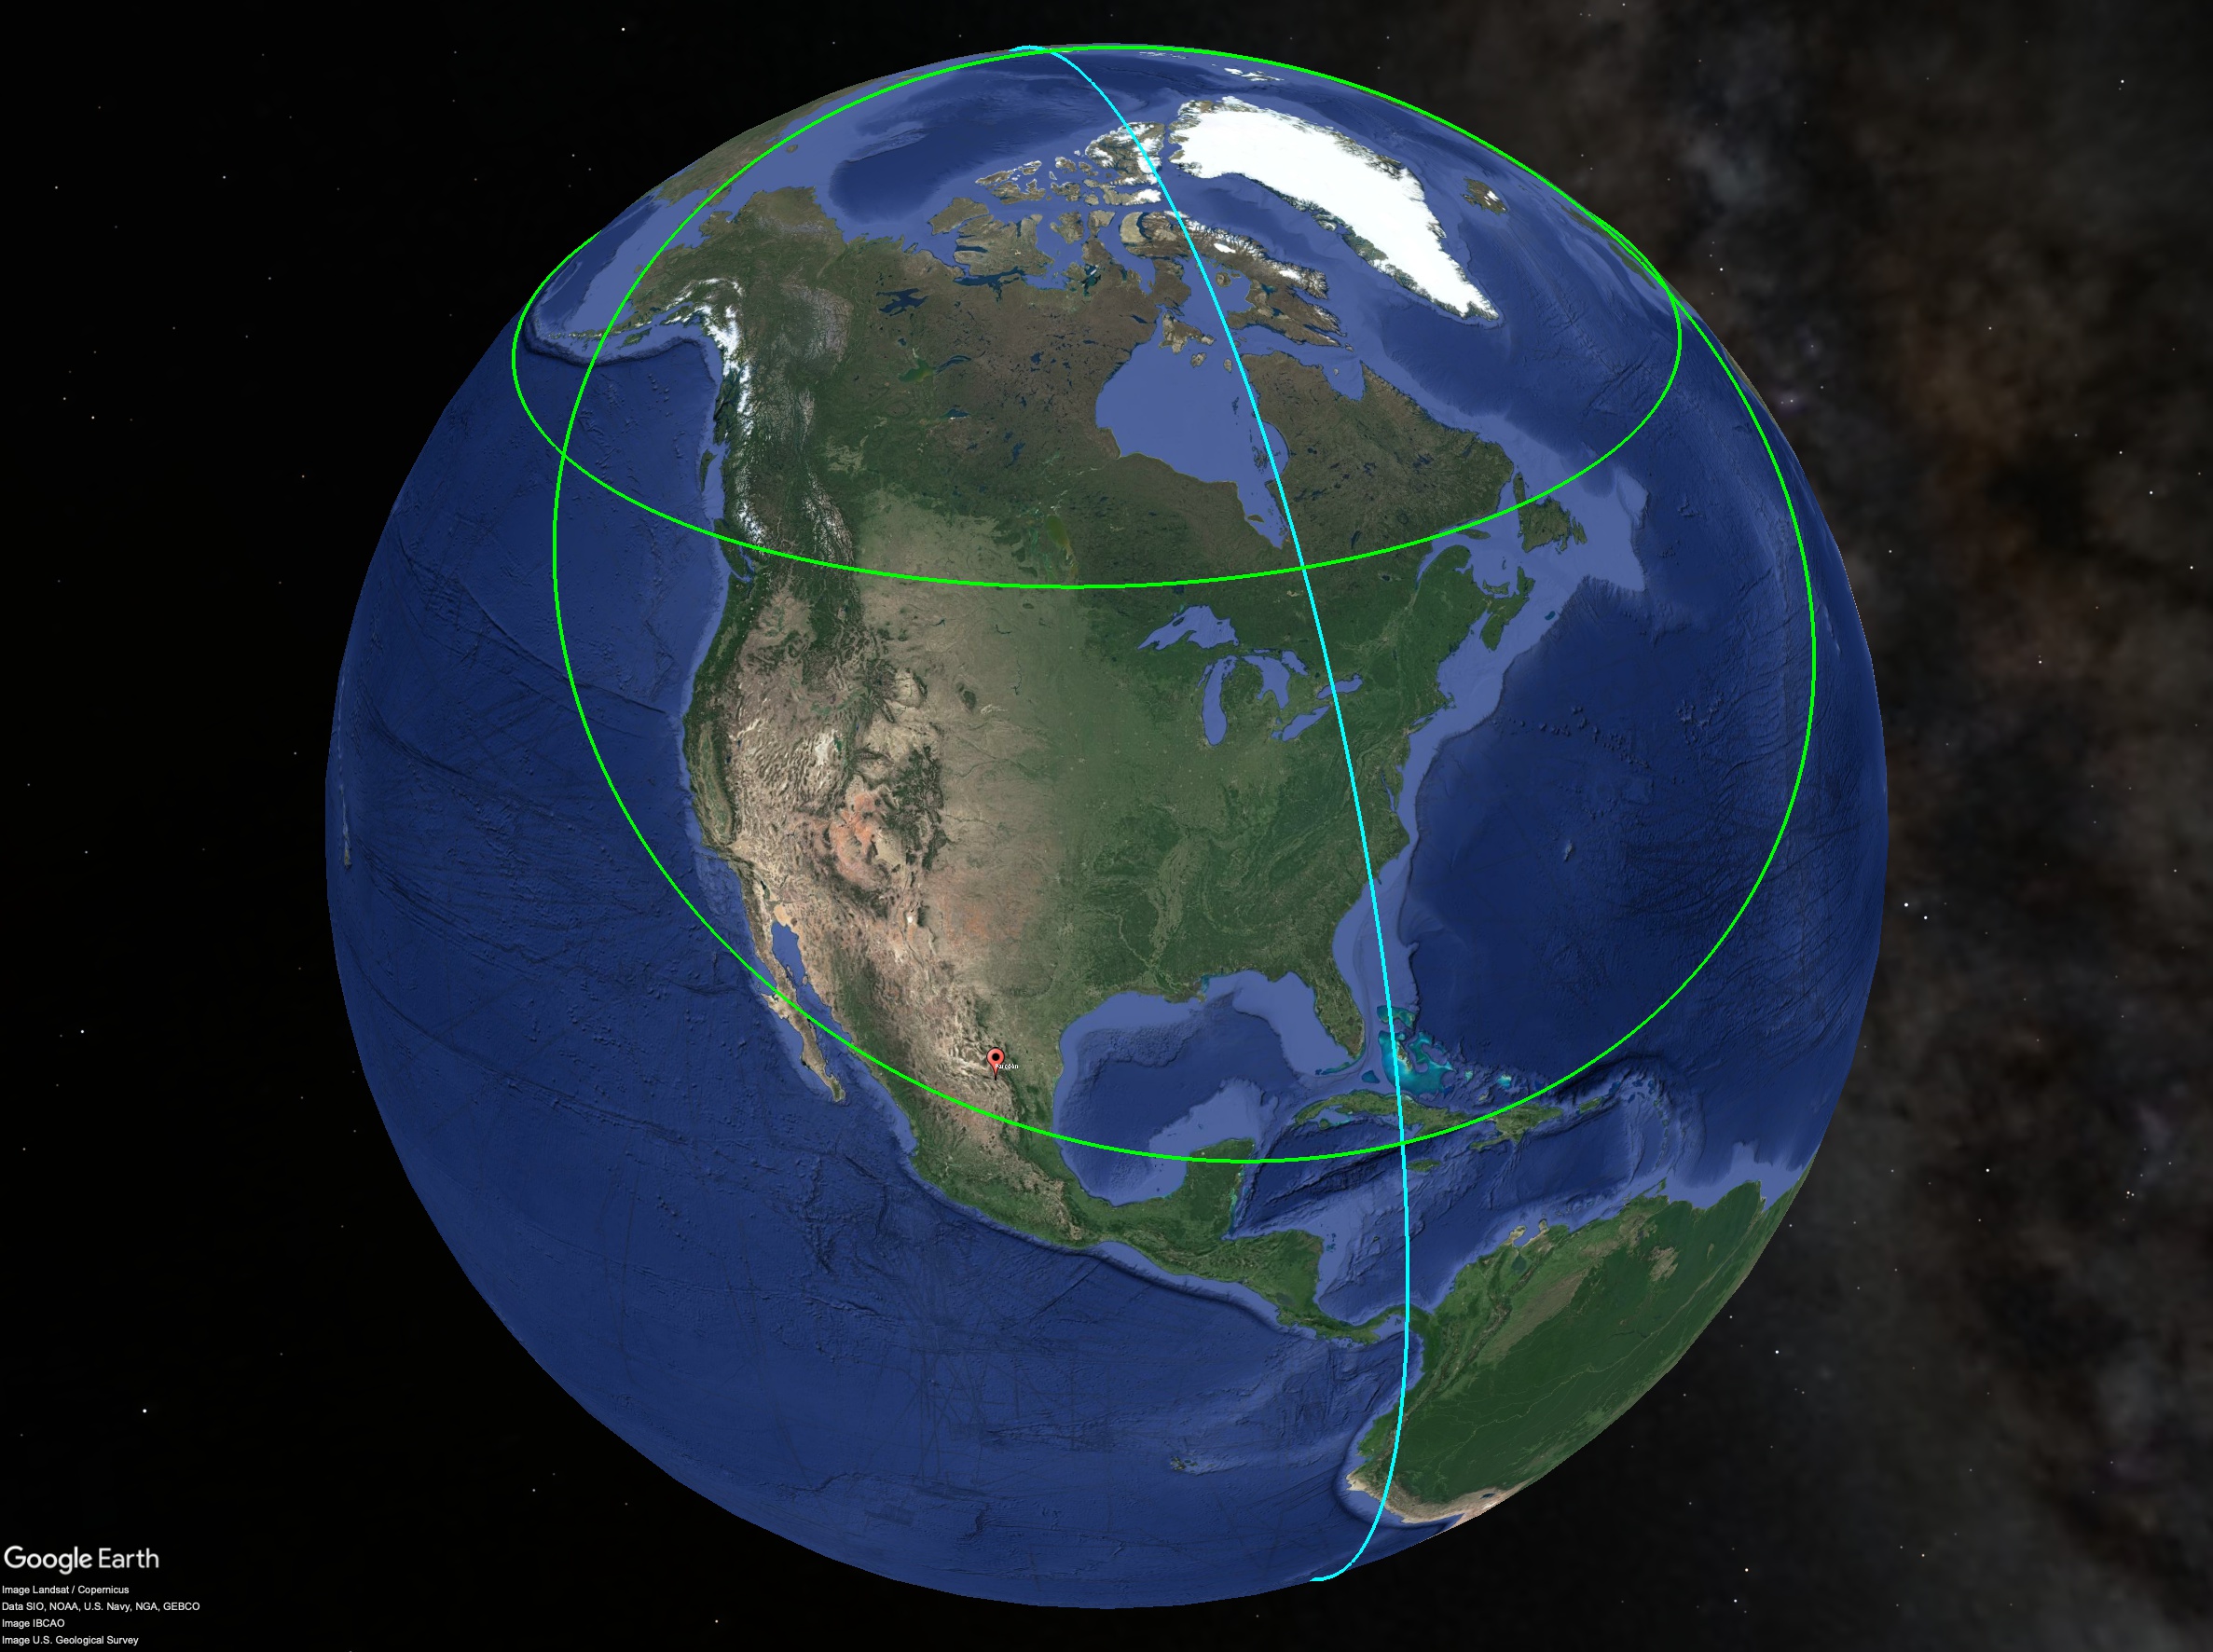
If a crustal displacement shifted the North Pole from Hudson Bay to the Arctic, the line of maximum displacement would have been only about 1400 miles to the east. Could horizontal stresses caused by a crustal displacement have been responsible for the unusual landscape around Paredon?

Google Earth image showing the unusual landscape around Paredon. (Click to enlarge)

Conclusion

Evidently, Dr. Leon never published a detailed account of his findings in a scientific paper:

The cities of Mexico are supposed to have been built not earlier than 1500 A. D.โ€”about 500 years ago. If any were built earlier, they are in ruins, but no remains of elephants have been discovered among the ruins, in fact no semblance of the elephant has been recognized in the sculpture, except in a few cases, where what resembles an elephantโ€™s trunk, or the trunk of a tapir, is found on the sculptured columns at Copan. The discovery of elephant bones would bo too important a matter to be ignored, but the article seems sensational and has been sent to the newspapers as a sensational item, and not to the scientific societies, so far as we have learned.

One has to wonder if Dr. Leonโ€™s field notes still exist in some form, in some place, say in the basement of the National Institute of Anthropology and History (INAH) in Mexico City, and if so, do they provide sufficient detail to tell us where his finds are located? In the same way ancient sites discovered in Turkey dated to 10,000 BCE or more replaced what had been the most ancient sites in Mesopotamia, could there be ruins in Mexico that are even older, perhaps thousands of years older than even the Younger Dryas, dating to the end of a previous age, to the end of the last ice age?

The Mammoth Steppe

During the Last Glacial Maximum (LGM), the Mammoth Steppe was a vast region that stretched from the Iberian Peninsula in western Europe, across Eurasia, through Beringia, and into North America. Besides the woolly mammoth, reindeer, muskox, antelope, bison, horses, and the woolly rhinoceros lived there during the North American ice age. Now extinct, the mammoth, which weighed up to nine tons, is estimated to have required about four hundred pounds of food each day to survive. With numerous mammoth remains found in Siberia above the Arctic Circle, it is a mystery how an animal the size of an elephant was able to find that much food in such a barren place. 

Mammoth sites that have been radiocarbon dated 20,000 – 45,000 years before present (click to enlarge). Approximate location of remains displayed with estimated extent of the northern ice sheet during the LGM. (Google Earth/Zurich University of Applied Sciences)

Explaining the Thickest Ice on Earth

As Earth warms, sea levels rise as ice at the poles melts. Similarly, as Earth cools, sea levels fall as glaciers form at the poles. 

In the north polar region, the thickest ice is in the mountainous interior of Greenland, about 1200 miles from the North Pole. In Antarctica, the thickest ice is not at its center at the South Pole but almost 1000 miles away in the high plateau of Eastern Antarctica. 

In the case of Greenland, the ice sheet has been accumulating for over 110,000 years, with some of the oldest ice found dating back over 800,000 years.  But why is the ice in Greenland just as thick in Antarctica, and why it is located where it is and not at the poles?

Hapgoodโ€™s Theory of Crustal Displacement

Hapgoodโ€™s theory, which is the starting point of our research in Before Atlantis, provides a simple and compelling explanation for why the thickest ice is where it is. In a previous article, we showed that the regions of thickest ice are the regions that have remained in the polar regions during the last four crustal displacements

All of the northern polar zone (regions above the Arctic Circle) were covered in ice during the LGM except for Siberia. Why?

According to Hapgoodโ€™s theory of crustal displacement, ice ages and inter-glacial periods are not caused by the Earth as a whole becoming significantly colder and then warmer but by different regions shifting into and out of the polar regions. If according to Hapgoodโ€™s data, now corroborated by Mark Gaffney, the North Pole were in Hudson Bay, not only would North America have been frozen under a continental ice sheet but Siberia and the whole Mammoth Steppe would have been in the temperate zone.

If a crustal displacement approximately 20,000 years ago shifted the North Pole from Hudson Bay to the Arctic Ocean, it would have changed Siberia from a temperate climate where mammoths and other animals that inhabited the steppe would have found more than enough food to the cold barren landscape we see today. Although the evidence is anecdotal, stories about the remains of plants that grow in temperate climates in the guts of frozen mammoth remains, support this hypothesis.

Feature image at the top of the article “Mammoth Steppe” generated by DeepAI’s Fantasy World Generator.

The Labyrinth, the Colossi, and the Lake: New Evidence of Advanced Prehistoric Civilizations in the Faiyum

This article presents the first verifiable space-based evidence of an enormous underground structure at Hawara that is likely the below-ground portion of the Labyrinth first mentioned by Herodotus. Combining historical sources with modern geospatial data reveals a discrepancy between Herodotusโ€™s account of colossal stone structures in the middle of Lake Moeris and Petrieโ€™s archaeological survey of much more modest ruins at Biahmu. An analysis of the alignment of the Labyrinth and other ancient sites in the Faiyum suggests they may be much older than we think.

Click here to read the full paper.

Click here for a more detailed paper about the Labyrinth.

The Labyrinth

The legendary Labyrinth of Hawara was brought to the attention of the Western world by Herodotus in the fifth century BC. He describes an above-ground structure that he saw, and one below-ground that he was denied access to by the Egyptians.

Moreover, they decided to preserve the memory of their names by a common memorial, and so they made a labyrinth a little way beyond lake Moeris and near the place called the City of Crocodiles. I have seen it myself, and indeed words cannot describe it; if one were to collect the walls and evidence of other efforts of the Greeks, the sum would not amount to the labor and cost of this labyrinth. And yet the temple at Ephesus and the one on Samos are noteworthy. Though the pyramids beggar description and each one of them is a match for many great monuments built by Greeks, this maze surpasses even the pyramids. It has twelve roofed courts with doors facing each other: six face north and six south, in two continuous lines, all within one outer wall. There are also double sets of chambers, three thousand altogether, fifteen hundred above and the same number under ground. We ourselves viewed those that are above ground, and speak of what we have seen, but we learned through conversation about the underground chambers; the Egyptian caretakers would by no means show them, as they were, they said, the burial vaults of the kings who first built this labyrinth, and of the sacred crocodiles. Thus we can only speak from hearsay of the lower chambers; the upper we saw for ourselves, and they are creations greater than human. The exits of the chambers and the mazy passages hither and thither through the courts were an unending marvel to us as we passed from court to apartment and from apartment to colonnade, from colonnades again to more chambers and then into yet more courts. Over all this is a roof, made of stone like the walls, and the walls are covered with cut figures, and every court is set around with pillars of white stone very precisely fitted together. Near the corner where the labyrinth ends stands a pyramid two hundred and forty feet high, on which great figures are cut. A passage to this has been made underground.

Sir Flinders Petrieโ€™s 19th-century survey provides a rough idea of the scale of the above-ground structure. His assessment was that the Labyrinth was maintained up to the second century BCE โ€“ “at least as late as Kleopatra I, 193 B.C., the Labyrinth was still in royal care, and probably being restored in some degree. Soon after that, ruin fell upon it, and in Pliny’s time it was โ€˜marvellously ravaged.โ€™โ€ Petrieโ€™s reconstruction of the western half of the Labyrinth indicates a north-south length of approximately 526 feet. Squaring that (assuming the structure is roughly square) yields an area of about 277,000 square feet.

Mataha Expedition

In 2008, the Mataha expedition reported the discovery of below-ground features resembling archaeological structures south of the Hawara pyramid of Amenemhet III:

These features covering an underground area of several hectares, have the prominent signature of vertical walls on the geophysical results. The vertical walls with an average thickness of several meters, are connected to shape nearly closed rooms, which are interpreted to be huge in number.

Very low frequency electromagnetic (VLF-EM) surveys revealed โ€œspatially distributed elongated and square shaped subsurface anomalies, which may identify the walls and rooms of the labyrinth mortuary temple complex.โ€

Approximate geolocation of an electrical conductivity map computed from VLF-EM surveys in Google Earth.

The presence of possible archeological features below ground suggests the possibility that what Petrie thought was the foundation of a large above-ground structure could instead be the roof of an undiscovered structure below ground. As the VLF-EM and other surveys were conducted over a limited area, it was not possible to determine the full extent of the underground structure.

Inspired by the discoveries of the Mataha expedition, a remarkable 3D reconstruction of the site using proprietary space-based technology revealed two levels of subterranean chambers over an extended area surrounding the pyramid of Amenemhat III. But unlike the Mataha findings, no accompanying scientific paper describing either the methodology or the data used was ever published making it difficult to corroborate their findings.

Spaceborne Radar Imaging

Under certain conditions, spaceborne synthetic aperture radar (SAR) is able to penetrate desert sands to reveal subsurface features. Sentinel-1, the first of the five missions developed by the European Space Agency under the Copernicus initiative, transmits vertically polarized waves and receives horizontally and vertically polarized waves that are processed to form VH and VV images. VV images tend to pick up height/vertical features whereas VH images tend to be more sensitive to surface textures. A portion of a C-band Sentinel-1 SAR image collected 7/6/2023 over a region in Western Egypt containing the Faiyum Oasis centered on the pyramid of Amenemhet III in Hawara is shown below.

Although there are a number of strong returns in its vicinity, the lack of a strong response from the pyramid itself is likely due to its highly eroded state. Several bright returns north of the pyramid (A) are from high-voltage transmission line towers (you can see one of the towers in the feature image at the top of the article). Below the pyramid in what is believed to be a mortuary complex are at least three returns that are rectangular in shape.

Sentinel image (left), with delineated regions (middle), and coregistered Google Earth image (right).

One of the delineated regions (B) is about 275,000 sq. feet โ€“ almost the same size as the rectangular area excavated by Petrie. Another region (C) may be the continuation of the above structure. A second rectangular area (D) west of the Faiyum canal is also evident in the SAR image. The lack of any structures in Google Earth imagery over these areas indicates that they are subsurface features. It is interesting that the orientation of these structures is not the same as the pyramid of Amenemhet III suggesting they are not part of the mortuary complex.

One of the Pedestals of Biahmu. (Einsamer Schรผtze/Creative Commons)

The Pedestals of Biahmu

Herodotus goes on to describe what he saw north of the Labyrinth:

Such is this labyrinth; and still more marvellous is lake Moeris, on which it stands. This lake has a circumference of four hundred and fifty miles, or sixty schoeni: as much as the whole seaboard of Egypt. Its length is from north to south; the deepest part has a depth of fifty fathoms. That it has been dug out and made by men’s hands the lake shows for itself; for almost in the middle of it stand two pyramids, so built that fifty fathoms of each are below and fifty above the water; atop each is a colossal stone figure seated on a throne. Thus these pyramids are a hundred fathoms high; and a hundred fathoms equal a furlong of six hundred feet, the fathom measuring six feet or four cubits, the foot four spans and the cubit six spans. The water of the lake is not natural (for the country here is exceedingly arid) but brought by a channel from the Nile; six months it flows into the lake, and six back into the river. For the six months that it flows out of the lake, the daily take of fish brings a silver talent into the royal treasury, and twenty minae for each day of the flow into the lake. 

When Petrie visited the ruins at Biahmu, he found the remains of two stone structures. Based on his reconstruction, stone figures, about forty feet tall, were emplaced on platforms about 30 feet high, for a total height of about 70 feet. This is only ยผ of the above water height reported by Herodotus, who coincidentally overestimated the circumference (perimeter) of the lake by a factor of four as well.

Lacking modern technology Herodotus cannot be faulted by the inaccuracy of his measurements. But there seems to be more to the discrepancy. In fact, Petrieโ€™s description of Biahmu does not seem to match Herodotusโ€™s at all:

When, six years ago, I visited the two so-called pyramids of Biahmu, about four miles north of Medinet el Fayum, I concluded from their appearance that it was very unlikely that they had really been pyramids, but rather that they were courts surrounding two great pedestals on which statues had stood. This result agreed nearly with the description of Herodotos, of two pyramids rising out of the water, each bearing a stone statue seated on a throne. His idea that they were large pyramids half submerged was easily to be explained by the fact of his visiting the province during the inundation, and his viewing them from Arsinoe, and not going down to Biahmu. The Arab name, Kursi Faraun, or โ€œthrone of Pharaoh,โ€ accords also with this idea ; they are, however, more usually known as es sanatn, the โ€œhigh placesโ€ or โ€œhigh things.โ€

Where was Herodotus when he saw the Colossi? The water level of Lake Moeris (see below) has varied considerably (up to 60 meters) over the last 10,000 years. Using a digital elevation model (DEM), we can estimate the water level when Amenemhet III is thought to have built the Colossi and when Herodotus saw them. Based on the DEM, Biahmu was above water at the time of Amenemhet III and below water when Herodotus was there. But more importantly, if the Colossi were partially below water, so too was the surrounding area over a radius of more than six miles. From this distance, the pyramids in Giza are barely visible let alone a structure the size reconstructed by Petrie. If the stonework that Petrie believed was a courtyard around the figures was the base of a pyramid 120 feet tall, even that would not be large enough to be visible from that distance.

Another possibility is that Herodotus was in a boat. But if he were, one would think he would have sailed up to Colossi to see them close up. After all, he did attempt (unsuccessfully) to visit the Labyrinthโ€™s underground.

An aerial view of the site shows the courtyards are not well-aligned in any particular direction. Different parts of the stonework surrounding the pedestals vary by several degrees in azimuth. This is in contrast with other Egyptian temples and monuments such as the Colossi of Memnon, which are aligned to the solstices.

If Herodotus was right about the Labyrinth, perhaps he was right about the Colossi as well.

A way of reconciling Herodotusโ€™s account and Petrieโ€™s reconstruction is to hypothesize that the structure Amenemhet III built, or possibly co-opted was once much larger. Like the Labyrinth, perhaps the original structure at Biahmu was dismantled and used as building material leaving only the modest reminder we see today.

Discussion

Qasr al Sagha is a megalithic structure north of Lake Moeris. Seemingly in the middle of nowhere, Qasr al Sagha would have been close to the lake shoreline when the water level was higher. The same is true of another site, Dimai (Soknopaiou Nesos), which is also north of Lake Moeris. It is believed that Lake Moeris existed as a paleolake more than 10,000 years ago. Although there have been variations in lake level even before the Faiyum canal, it has decreased significantly in size over the past 2500 years.

Devoid of any inscription, little is known about Qasr al Sagha. Composed of giant limestone blocks, its architectural style indicates Middle to Old Kingdom. That it is oriented in the direction of minor lunar standstills, not uncommon in desert regions, suggests Qasr al Sagha could have been a lunar temple.

Alignments of Qasr al Sagha (top left) and Medinet Madi (top right) to the moon. Alignments of Medinet Madi (bottom left) and Labyrinth (bottom right) to the Greenland pole.

Other sites in the Faiyum are more difficult to explain in terms of their alignment. Madinet Madi (โ€œCity of the Pastโ€) is not aligned in known geographical/astronomical directions, however, its minor axis would have aligned with minor lunar standstills relative to the Hudson Bay pole – the hypothesized location of the North Pole during the North American ice age, 20,000 to 45,000 years ago. The alignment of its major axis would have been in the direction of the Greenland Pole, another proposed location of the North Pole even further back in time, 75,000 to 130,000 years ago. Subsurface features at Hawara, which are not aligned with the pyramid of Amenemhet III, are also oriented in the direction of the Greenland pole. Based on an application of Hapgoodโ€™s theory of crustal displacement theory, these alignments may be the fingerprint of at least two prehistoric civilizations in the Faiyum over the past 100,000 years or so.


Feature image at the top of the article courtesy Explore Faiyum .

New Discoveries at Mitla

In 1674, a Catholic priest, Francisco de Burgoa reported the discovery of a subterranean labyrinth under the ruins of Mitla. Immense stone chambers were said to extend many miles underground. 

In 2022, a joint research expedition by the Mexican National Institute of History and Anthropology (INAH), the National Autonomous University of Mexico (UNAM) and the Association for Archaeological Research and Exploration (ARX) uncovered evidence of a large void under the Catholic Church. Electrical resistivity tomography revealed the void is connected to underground chambers extending west, north, and east of the church.

Site Alignment

Numerous places in Mesoamerica contain structures aligned in a direction roughly 17 degrees east of north – places such as Teotihuacan, Tenayuca, Xochicalco, Ekbalam, Altun Ha, Copan, Tikal, Uxmal, and Mitla.

No single compelling reason for their alignment exists within the mainstream archaeological community. In Before Atlantis, we propose that these sites were first established during the last ice age when, according to Charles Hapgood in his theory of earth crustal displacement, the North Pole was in Hudson Bay and Mexico would have had a temperate climate. It is our contention that what archaeologists have discovered about the more recent pre-Columbian people that lived there is but one chapter of a much more ancient history.

Overlaying current geometrical and astronomical alignments on a Google Earth image of the Church Group of structures at Mitla shows the site is not aligned to the cardinal directions (N-S-E-W), or to the sun (solstices) or moon (lunar standstills).ย 

Current geometrical/astronomical alignments at Mitla.

Displaying alignments relative to the Hudson Bay pole suggests the possibility that if the site was first established when the North Pole was in Hudson Bay the original structures would have been cardinally aligned N-S-E-W relative to the former pole.

Hypothesized geometrical/astronomical alignments of Church Group relative to the Hudson Bay pole.

Structures in the Columns Group would have been similarly aligned.

Hypothesized geometrical/astronomical alignments of Columns Group relative to the Hudson Bay pole.

What makes this hypothesis compelling not only for Mitla but also for the other sites mentioned above is that it explains the alignment of all of them in a simple way.

Hypothesized alignments of Mesoamerican sites to Hudson Bay pole.

In the next few months, the independently-funded joint research expedition hopes to continue its investigation of Mitlaโ€™s underground spaces. Click here and support one of the most important archeological discoveries in decades.

The image at the top of the article is courtesy Thayne Tuason/Creative Commons.

New Evidence At the Poles Supports Crustal Displacement Theory

In Before Atlantis, we set out to explore the idea that shifts in the location of the North and South Poles were responsible for the misalignment of hundreds of ancient sites across the world. In the process, we have discovered (or rather rediscovered) how displacements of Earth’s crust – the reason the poles move – could also explain glacial cycles. In a recent paper, we described how changes at the North Pole predicted by pole shifts are correlated with the rise and fall of global sea levels over the past 130,000 years. In this article, we show that what was happening at the South Pole over this period also supports the crustal displacement theory.

Changes in the Northern Polar Zone

Charles Hapgood first hypothesized that glacial cycles were the result of climate changes caused by slippages of the Earthโ€™s crust – that ice ages were not caused by global temperature fluctuations but were the direct result of different geographic regions moving in and out of the polar zone. 

If the crust displaces over the mantle, climate zones change in predictable ways. The circles define climate zones. In this figure, white is the polar zone, green is the temperate zone, yellow is subtropical, and red is the equator.

We showed in a previous article that the extent of the northern ice sheet at the time of the last glacial maximum (LGM) was consistent with the accumulation of ice over a gradually increasing landmass that had been shifted into the northern polar region by a series of crustal displacements as illustrated below.

As shown below, the union of these regions is a pretty good approximation of the extent of the ice sheet at the LGM.

What is interesting is that if we take the intersection of these circles – the current and past northern polar zones (from about 66ยฐ N) over the past 130,000 years, the area highlighted in the following figure has remained in the polar zone continuing to accumulate snow and ice over this period.

The intersection of polar zones for current (white), Hudson Bay (magenta), Norwegian Sea (yellow), and Greenland (green) poles. The circular triangle region has been in the northern polar zone for more than 130,000 years.

It turns out that the thickest ice in the current northern polar zone, in Greenland, is in this region.

The circular triangle region contains the thickest ice (dark red) in Greenland.

Antarctica

Performing a similar analysis at the South Pole, the largest area in Antarctica having the thickest ice has also been in the polar zone for the past 130,000 years.

The intersection of polar climate zones at the South Pole and an Antarctic ice thickness map (thickest ice is dark red).

Aside from central Greenland, most of the landmass in and around the North Pole is relatively flat. According to our theory, when landmasses move into the polar zone, they begin to accumulate snow and ice. When they move out of the polar zone, the ice melts. The situation in the Antarctic is different because of its elevation. Glaciers exist in the Alps, Himalayas, Andes, and other mountainous areas in the world that are more than two to three thousand meters in elevation. About 40% of Antarctica is 2500 meters or more above sea level.

The ice over most of the Southern Continent (at least 62%), which is more than 1500 meters in elevation probably would not have melted even if it had been shifted well out of the polar zone. Thus, in contrast to the accumulation and melting of ice in the northern polar zone and its effect on global sea levels, changes in the location of Antarctica would have been less of a factor.

The mountainous interior of Greenland has the most ice, which coincidentally has remained in the polar zone for the past 130,000 years. As shown below, areas with the thickest ice in Antarctica are not always the highest in elevation as they are in Greenland.

Antarctic ice thickness map (thickest ice is dark red) and elevation map (highest regions are light red).

The Bottom Line

We have shown that changes in the geographic location of the polar zone, which Hapgood believed was responsible for ice ages in different parts of the world at different times, can explain the extent of the northern ice sheet at the time of the LGM, why the thickest ice at both the North and South Poles is where it is, and how, as discussed in the previous article, portions of Antarctica could have been ice-free during the North American ice age. Future articles will examine other implications of Hapgood’s revolutionary theory.

Computer generated image “Base camp at the edge of the Antarctic glacier” circa 20,000 years ago. This and the image at the top of the article were created using deepAI’s Fantasy World Generator.

Maps of the Ancient Sea Kings โ€“ New Evidence of Their True Antiquity

Hapgoodโ€™s analysis of maps in use during the Middle Ages known as portolans revealed their accuracy was better than what was possible given the nautical knowledge of the time. An analysis of one of those maps โ€“ the Orontius Fineaus map of 1531 supports the hypothesis that the original sources on which it was based could predate the current historical period to a time when the geographic poles were in a different location and Western Antarctica was ice-free.

Click here to read full paper.

Charles Hapgood

In Maps of the Ancient Sea Kings, Charles Hapgood, with the help of his students at Keene State College discovered that certain ancient maps could be thousands of years old or more based on both the detail and accuracy of the information they contain. Perhaps the most famous, the Piri Reis (PR) map of 1513 appears to depict a part of the Antarctic coastline, a fact at odds with the general belief that the southern continent was not discovered until the 19th century. Remarkably, another map, the Orontius Fineaus (OF) map, which was drawn in 1531 shows the whole of Antarctica with details suggesting much of it was once ice-free.

Portion of Orontius Finaeus map showing evidence of an ice-free Antarctica. (Wikipedia/Creative Commons)

An Ice-Free Antarctica?

Although there is no scientific evidence supporting a continent entirely free of ice, Scherer et al. show that some glacial sediment samples recovered from beneath the West Antarctic ice sheet indicate the Ross Embayment could have once been an open marine environment during the Pleistocene as early as Marine Isotope Stage (MIS) 11 or 5e, or 100โ€“400 Kya. The configuration of West Antarctic seaways after a hypothetical collapse of the West Antarctic Ice Sheet is not inconsistent with Hapgoodโ€™s hypothesis of a previous pole in Hudson Bay having the corresponding South Pole off the eastern coast of Antarctica in the South Indian Ocean. With the pole at this location, West Antarctica would have been outside of the south polar region providing an alternative mechanism to explain the collapse of the West Antarctic ice sheet.

South Pole and surrounding polar region (white circle) and the polar region surrounding a hypothesized pole in the South Indian Ocean (magenta circle). (Google Earth)

Analysis of Hapgoodโ€™s Analysis

In a detailed analysis of the OF map, Hapgood found approximately fifty geographical features that he could identify on a modern map. Plotting the difference (error) between the OF and true map coordinates reveals a random distribution of errors with no apparent trend (correlation) with respect to either latitude or longitude.

Errors between OF and true map coordinates (black lines) and between estimated OF and true map coordinates (brown lines) assuming original OF source(s) were based on a spherical model of the Earth. (Google Earth)

Most maps at the time the OF and PR are thought to have been drawn were portolans (port-to-port navigational maps) rendered in planar projections. It has been suggested that certain maps such as the OF were redrawn from earlier maps that had been based on a spherical model of the Earth. In exploring this idea we can estimate what the OF map coordinates would have been had they based on a knowledge of spherical geometry with any remaining differences due to errors in the original source(s). Plotting differences between true and estimated OF map coordinates reveals a subtle, but statistically significant trend.

Scatter plot of location error (in meters) between true and estimated OF map coordinates vs. longitude. A positive correlation (R=0.39) indicates errors are greater in Eastern Antarctica.

Evidence of an Earlier Pole?

Other than there being fewer identified features in the interior of Antarctica, i.e., near the South Pole, there is no statistical evidence that there was any less ice in the interior than along the coastline. The positive correlation in the scatter plot indicates an increase in map errors in positive (eastern) longitudes. This is consistent with the hypothesis that the OF map was compiled when Western Antarctica had less ice (more land area was exposed) than Eastern Antarctica. But why would land west of the South Pole be ice-free while land east of the Pole was not?

One possibility is that Western Antarctica was ice-free because the South Pole was located about 2,000 miles east of its present location. If this were so one would expect errors to be correlated with distance to the old pole. In fact, the largest errors vs. longitude relative to the current pole point in the direction of a hypothesized pole in the South Indian Sea.

Polar plot shows greatest OF map errors are in Eastern Antarctica in the direction of a South Indian Ocean pole. (Google Earth)

What Could This Mean?

Hapgoodโ€™s analysis of portolan maps in use during the Middle Ages revealed their accuracy was better than what was possible given the nautical knowledge of the time. He even goes as far as stating โ€œwe have evidence here that all the portolans stemmed from a common origin in ancient times.โ€ In our analysis of Hapgoodโ€™s analysis of the Orontius Finaeus map, we find OF and true map longitudes are more correlated than OF and true map latitudes, which is hard to explain in light of the fact that accurate longitudes requires accurate clocks, which did not exist at that time.

Our findings support the idea that if the original OF map were based on a spherical model of the Earth, errors would likely increase in Eastern Antarctica if the landscape was covered in ice by virtue of it being closer to the former pole than in Western Antarctica, which would have been well outside of the polar zone and so have been ice-free. It is possible that lands to the east covered with ice were likely less accessible and so not as well mapped as those to the west.

Putting it all together, we propose that the sources of the OF and other similar maps of the time were not only pre-Greek as Hapgood believed but predate the current historical period, specifically to a previous world age in which the North Pole was in Hudson Bay and the corresponding South Pole was in the South Indian Ocean, approximately 2,000 miles east of its current location.

A New Theory of Earth Crustal Displacement

Breathing new life into Charles Hapgoodโ€™s theory of earth crustal displacement/pole shifts, a new paper proposes that short-term reversals of the geomagnetic field may โ€œunlockโ€ the crust sufficiently to allow tidal forces to pull it over the mantle in the same way they move earthโ€™s oceans. With existing climate theories unable to provide a satisfactory explanation of glacial cycles and ice ages, a revised version of Hapgood’s theory has been developed that explains sea-level changes resulting from the buildup and melting of polar ice over ice age/glacial cycles by a combination of Milankoviฤ‡ cycles and Hapgood pole shifts.

Click here to read the paper.

Watch a video presentation sponsored by the Society for Scientific Exploration.

Introduction

In this article, we begin by revisiting Hapgoodโ€™s theory of earth crustal displacement in the context of recent developments in climate and geoscience and show that it may be the missing link in understanding not only the rise and fall of past civilizations, as we first set out to do in Before Atlantis, but ice age/glacial cycles as well. A modified version of Hapgood’s theory is then described based on a new mechanism that is triggered by short-term reversals of the geomagnetic field that โ€œunlockโ€ the crust from the mantle and driven by earth-moon-sun tidal forces, the same forces that move earthโ€™s oceans. 

Courtesy University of Wisconsin-Madison.

Milankoviฤ‡ Cycles

In the 1920s, Milutin Milankoviฤ‡ proposed that changes in earthโ€™s eccentricity, axial tilt (obliquity), and precession result in cyclical variations in the amount of incident solar radiation (insolation) reaching the earth. Insolation is generally assumed to be a major driver of climate change over long periods. From 1โ€“3 million years ago, climate patterns were correlated with the earthโ€™s 41 Ky-long obliquity cycle. Then, about a million years ago, patterns began to follow a 100 Ky cycle that is between the 95 Ky and 125 Ky cycles in earthโ€™s orbital eccentricity. Why the period of climate patterns changed, the origin of the 100 Ky cycle, and why insolation lags rather than leads climate changes are among some of the problems that cannot be explained by Milankoviฤ‡ cycles. Perhaps the greatest shortfall of Milankoviฤ‡โ€™s theory is the inability of insolation in itself to accurately account for the periodic buildup and melting of polar ice over glacial cycles.

Average daily mean top of the atmosphere (TOA) insolation at 65ยฐN over the past 250 Ky and global sea level, which is inversely related to the amount of polar ice. 

The two time series, insolation and global sea level, shown above are weakly correlated (R=0.14). There is a somewhat higher (R=0.33) correlation between insolation and temperature, and an even greater correlation (R=0.63) between insolation and changes in sea level as a function of time. The reason for the increased correlation is that as insolation increases, temperatures increase, polar ice melts, and sea levels rise. Conversely, as insolation decreases, temperatures decrease, precipitation freezes and accumulates at the poles, and sea levels fall. Exploiting this correlation, we can estimate mean sea level change โˆ†s(t) as a function of insolation Q(t) that when summed provide an estimate of sea level s(t) as a function of insolation over time.

Global sea level change predicted from insolation, which when summed provides an estimate of global sea level as a function of insolation.

What Insolation Does Not Predict

Over the last two glacial cycles, insolation tends to underpredict sea level (over predict polar ice) at the beginning of a cycle and over predict sea level (under predict polar ice) at the end. In other words, a greater amount of ice melts at the beginning and accumulates at the end of a glacial cycle than what is predicted by insolation. 

Difference between sea level predicted from insolation and actual sea level over the last glacial cycle.

Pole Shifts and Sea Level Changes

Insolation increases as we move toward the equator. Allowing the geographic location of the earthโ€™s poles to shift relative to the rotational axis as Hapgood proposed provides a means that can potentially account for the difference between the above sea-level curves. Before the start of a glacial cycle, a large amount of water is stored in an ice sheet around the pole. If the crust displaces enough to move the ice sheet out of the polar zone, the increased amount of solar radiation at lower latitudes will cause the ice to melt raising sea levels. After a period, an ice sheet begins to form at the new pole causing sea levels once again to fall.

Crustal displacements cause former polar regions to shift south toward the equator.(Google Earth)

Sea levels decrease in stages during a glacial cycle suggesting a continued buildup of ice near the poles. Notice the land area around the pole is different at different pole locations. Since ice forms and accumulates more readily on land than over the ocean, if the land area at the new pole is greater than the land area at the old pole, sea levels after a pole shift should eventually fall to a lower level as there is a greater area for ice to accumulate. Based on measurements of land area in the Arctic circle and former polar regions there is a strong correlation between the size of the ice sheet (assumed to be determined by land area) and sea level for the current and four prior pole locations. Successive increases in available land area following the Bering Sea to Greenland pole shift have led to successive decreases in sea level. This suggests that the magnitude of crustal displacements during a glacial cycle, i.e., before the last glacial maximum (LGM) and penultimate glacial maximum (PGM) were small enough to keep the accumulating mass of ice in the polar zone. The precipitous rise in sea level after the LGM and PGM suggests that larger magnitude crustal displacements shifted the ice sheet farther south to melt a significant fraction of the accumulated ice. 

A Possible Mechanism for Crustal Displacements

In his original theory, Hapgood proposed polar ice creates mass imbalances that can cause the crust to slip over the mantle shifting the geographic location of the North Pole. Einstein later argued that the force of the ice was not sufficient to cause a crustal displacement. Using models of the crust and ice sheets at the LGM to estimate the degree to which the ice could have affected the earthโ€™s moments of inertia, it has been determined that if the crust were free to move, the ice would have shifted the pole by less than 0.25ยฐ relative to its present position. 

If the first part of Hapgoodโ€™s theory is wrong, that ice cannot move the pole, is there another way to save the rest of his theory?

An analysis of alternative mass distribution models reveals the theoretical axis of rotation (TRA) of the crust deviates significantly from the earthโ€™s rotational axis and so may not be in equilibrium with the earth. We have determined the crustโ€™s TRA is at 1.21ยฐN, 18.52ยฐ W. This location lies in the zone of the tropics almost on the equator. At the equinox, the equator is parallel with the ecliptic plane. At other times of the year, the ecliptic passes through the earthโ€™s equatorial region between the tropics of Cancer and Capricorn. The path of the sun, moon and most other bodies in the solar system lies along the ecliptic. That the crustโ€™s TRA points in this direction suggest the possibility the crustal disequilibrium may have an external (i.e., extraterrestrial) cause.

The influence of the moon, and to a lesser extent, the sun, are responsible for the earthโ€™s tides. The balance between gravitational and centrifugal forces causes the earth (primarily its oceans) to elongate in the direction of the moon by 1.34 meters and the direction of the sun by 0.61 meters. As the earth rotates, tidal forces cause the oceans to rise and fall twice a day. These forces also pull on the crust. It has been proposed that tidal forces acting on the crust could be a possible trigger for certain kinds of earthquakes. 

Possible role of tidal forces in changing the position of the crustโ€™s theoretical axis of rotation (TRA).

Tidal torques acting on the earth and moon dissipate energy. With the crust โ€œlockedโ€ to the mantle, the energy loss manifests as the frictional heating of the crust and oceans. If, however, the crust became โ€œunlockedโ€ the effective work could result in a displacement of the crust over the mantle. The key to crustal displacement thus becomes the question of whether there is a way for the crust to become unlocked from the mantle. 

A growing body of evidence suggests changes in the earthโ€™s magnetic field may influence climate. Over the last 83 million years, 183 geomagnetic reversals have taken place in which the poles changed polarity. Geomagnetic reversals occur, on average, 450 Ky years apart. Long periods (millions of years) in which the magnetic poles do not flip preceded the four largest extinctions on earth: the Cretaceous-Tertiary (KT), Triassic-Jurassic (TJ), and the Permo-Triassic (PT) and Guadalupian-Tatarian (GT) doublet. Between geomagnetic reversals, events known as geomagnetic excursions take place where the field temporarily reverses for a shorter period (thousands of years or less).

Earthโ€™s magnetic field (top). Bottom left to right shows the normal polarity of core and crust, polarity during a geomagnetic excursion, rotation of crust, and return to original field polarity

One possibility is that changes in the magnetic field during a geomagnetic excursion may affect the ease with which the crust can move over the mantle. Magnetic dipoles of ferromagnetic minerals in the crust normally line up in the same direction as those in the core resulting in continental ferromagnetic fields. It is conjectured that when the core magnetic field flips during a geomagnetic excursion, the dipoles in the crust temporarily point in the opposite direction to produce a repulsive force between the crust and core fields. If this force, perpendicular to the crust, is sufficient to reduce the frictional force between the crust and mantle, it may be possible for forces acting on the crust parallel to the surface to move the crust over the mantle while the geomagnetic field is reversed. When the geomagnetic field flips back the crust is once again locked to the mantle maintaining disequilibrium.

Sea level predicted from insolation (dotted) and actual (solid) curves. Approximate dates of geomagnetic excursions (circles) and volcanic eruptions (triangles).

Correlated Events

Although there is no way to test our conjecture directly, correlations between geomagnetic excursions, super-volcanic eruptions, and glacial events could imply causation. The Blake geomagnetic excursion occurred 15โ€“20 Ky after the PGM. The Volcanic Explosivity Index (VEI) is a relative measure of the explosiveness of volcanic eruptions.  The next two geomagnetic excursions were each followed by massive VEI 8 magnitude volcanic eruptions. The most recent Toba eruption 73โ€“75 Kya followed the Norwegian-Greenland Sea excursion. The Oruanui eruption of New Zealandโ€™s Taupo volcano followed the Lake Mungo excursion 28โ€“30 Kya. The somewhat smaller VEI 7 Phlegraean Fields eruption followed the Laschamp event 40โ€“42 Kya.

Although the trigger mechanism for geomagnetic reversals is not clear, crustal shifts could provide an explanation for earthquake activity, volcanic eruptions, and other events that follow geomagnetic excursions. The Blake, Norwegian-Greenland Sea and Lachamps geomagnetic excursions precede three episodes of sea level decline/increase of polar ice. The Lake Mungo geomagnetic excursion occurs just before the LGM after which global sea levels began to rise to current levels. According to the model, crustal displacement(s) triggered by the Mungo Lake and possibly the Gothenburg geomagnetic excursions shifted most of the ice sheet that had formed up to the LGM almost 2,000 miles south well into the temperate zone leading to rapid melting and sea-level rise. The Younger Dryas event was also likely a significant contributor to glacial melt. All four events appear to be somewhat correlated with Milankoviฤ‡ cycles evident in the insolation curve. Three precede major volcanic eruptions. 

Conclusion

We show how Hapgood pole shifts working in conjunction with Milankoviฤ‡ cycles provide a possible explanation for climate changes over past glacial cycles. That the crust does not appear to be in equilibrium with the whole earth in terms of their moments of inertia suggests the possibility that an unknown force could be at work. We propose earth-moon-sun tidal forces may be responsible, and that these forces, which move the earthโ€™s oceans might provide sufficient energy to displace the crust a significant distance during a geomagnetic excursion. It is our hope that these new findings will lead to further work in these and other related areas of research.

The featured image at the top of the article was captured by the astronauts about the International Space Station.

Rome Wasn’t Built In a Day: New Evidence the Eternal City May be Older Than We Think

Although most historical accounts are rooted in the legendary founding of Rome by Romulus and Remus in 753 BCE we present new evidence based on astronomical alignments that the place we now call Rome may have been first established tens of thousands of years earlier.

Click here to download paper from SSRN.

Introduction

Analysis of the alignment of Roman towns reveals the distribution of geographic orientations is decidedly non-random (Magli 2008). Most are laid out in solar directions from due east-west to directions north and south that are within the range of sunrise/sunset directions over the course of the year. These alignments span the range of lunar directions except for extreme northerly and southerly moonrises and moonsets at the time of major lunar standstills which occur every 18.6 years. Spiravigna (2016) has found evidence of lunar alignments at Roman sites including the Decumani of Naples, Augusta Emerita, known today as Merida, in Spain, and Curia Julia in the Forum of Rome. 

Lunar Alignments

Most are familiar with the seasonal path of the sun โ€“ that it rises in the east and sets in the west, more or less. The motion of the moon, however, is more complex and perhaps, as a result, is seen as being more mysterious. The moonโ€™s movements are more complex than the sunโ€™s for several reasons. The moon completes one orbit around us in a much shorter time than we do around the sun and so does in a month what the sun does in a year, in terms of the changing rising and setting direction along the horizon. The plane of the moonโ€™s orbit is tilted by 5.1ยฐ relative to the ecliptic and so can rise and set more northerly and more southerly than the sun. Due to the effects of the sunโ€™s gravity, the moonโ€™s orbital plane does not stay fixed in space but precesses, causing the monthly angles of moonrise and moonset to change over an 18.6-year cycle. Every 18.6 years the moon rises and sets at its maximum northerly and southerly directions, which is known as a major lunar standstill. 9.3 years later a minor lunar standstill occurs when the moon rises and sets at its minimum northerly and southerly directions. Both of these times appear to have been important to ancient builders throughout the world.

Ancient ruins on Palatine Hill.

The City of Rome

According to legend, the city of Rome was founded by the sons of Mars, the twin brothers Romulus and Remus on April 21, 753 BCE. Seven hills comprise the city of Rome. Temples dedicated to the Roman goddess Luna once existed on Aventine and Palatine hills.

The alignment of grid patterns on both Aventine and Palatine hills lie in the direction of most southerly moonrises and northerly moonsets. The alignment of the Roman Senate building, Curia Julia, in the Roman Forum is in the direction of most northerly moonrises and southerly moonsets. Alignments in all three areas are in major lunar standstill directions.

The Field of Mars

West of the old city lies Campus Martius – The Field of Mars. One of the oldest Roman temples, the Pantheon, is here just east of Piazza Navona. Unlike the Roman Forum, and Palatine and Aventine hills, this part of Rome is laid out in a direction that currently has no known astronomical or geographic significance. 

In a study of more than two hundred archaeological sites (Carlotto 2020a), it was discovered that the alignment of almost half of the sites examined could not be explained in terms of known directions. Approximately 80% of the sites were found to reference four locations within 30ยฐ of the North Pole (Carlotto 2019a) that, if Hapgoodโ€™s theory of earth crustal displacement is correct, could have been former locations of the North Pole over the past 100,000 years (Carlotto 2020b). 

The orientation of the Pantheon (right) and surrounding area including the Piazza Navona (left) are in the direction of major lunar standstills relative to the Hudson Bay pole.

The Pantheon is one of these sites. Shifting the geographic reference point from the current North Pole to a previous pole in Hudson Bay, the Pantheon and surrounding area become aligned in the direction of major lunar standstills relative to the Hudson Bay pole. Based on the chronology established by Gaffney (2020), if the Romans had built the Pantheon over a previous structure that was aligned to a former pole in Hudson Hay, based on its alignment, the original site could have been established at least 12,000 to 18,000 years ago.

Ancient Foundations

Examples of newer structures built over older pre-existing structures can be found throughout the world. Seven stages of construction are evident at Baalbek. Under the Parthenon in Athens lies an older Parthenon (Beard 2010). There are many examples of this practice, now known as adaptive reuse, in Rome. Walking through the old city modern buildings built over and alongside ancient ruins are everywhere.

Previous constructions at San Clemente basilica (https://brewminate.com/adaptive-reuse-of-ancient-buildings-in-rome/)

But what lies underneath Rome? According to Tom Mueller in his article โ€œUnderground Rome,โ€ something is buried beneath everything in Rome. Roman architects tore the roofs from old buildings filled their interiors and used them as foundations for newer structures. Four levels have been excavated within San Clemente, a twelfth-century basilica just east of the Coliseum. 

Descend the staircase in the sacristy and you find yourself in a rectangular hall decorated with fading frescoes and greenish marbles, lit by sparse bulbs strung up by the excavators. This is the original, fourth-century San Clemente, one of Rome’s first churches. It was condemned around A.D. 1100 and packed full of earth, Roman-style, as a platform for the present basilica. A narrow stair near the apse of this lower church leads down to the first-century structures upon which it, in turn, was built: a Roman apartment house and a small temple. The light is thinner here; cresses and fungi patch the dark brick and grow delicate halos on the walls behind the bare bulbs. Deeper still, on the fourth level, are several rooms from an enormous public building that was apparently destroyed in the Great Fire and then buried by Nero’s architects. At about a dozen yards below ground the massive tufa blocks and herringbone brickwork are slick with humidity, and everywhere is the sound of water, flowing in original Roman pipes. No one has excavated below this level, but something is there, for the tufa walls run another twenty feet or so down into the earth.[5]

The fourth-century church was filled with rubble and used as the foundation of the current basilica, whose aisle and nave were lined up with that of the one below it. In this way, the alignment of the original structure defines that of later structures built over and around it.

The Oculus

Spiravigna (2018) considers the question of what could have been seen through the opening (oculus) of the Pantheon. Rome is located approximately 42ยฐ north of the Equator. Relative to the Hudson Bay pole, its latitude would have been about 35ยฐ.

35ยฐ parallel relative to current pole (bottom) and Hudson Bay pole (top).

Earthโ€™s axial tilt or obliquity is currently 23.5ยฐ. Numerical models suggest the obliquity, which varies cyclically could be as large as 24.5ยฐ. The declination of the moon at a major standstill at maximum obliquity would be approximately 24.5 + 5.1 = 29.6ยฐ. The diameter of this opening or oculus at the top of the structure subtends a 10ยฐ region centered at the zenith. The angular diameter of the moon is about 0.5ยฐ and so would have been almost visible through the oculus at this time from below. If one looked up and stepped back toward the doorway, the moon would become visible at its zenith.

Side view of the Pantheon. Directly below the oculus, the moon would be hidden. Walking a few steps to the north the limb of the moon would become visible during a major lunar standstill.

Discussion

The Parthenon is thought to have been aligned toward sunrise on August 15, the date of Athenaโ€™s birthday (Carlotto 2019b). Using a similar rationale, we have been unable to find any structure in Rome aligned in the direction of sunrise (74ยฐ) or sunset (286ยฐ) on the cityโ€™s founding date of April 21. The orientation of the Roman Forum (294ยฐ), which is well north of this direction, like structures on Palatine and Aventine hills, is aligned to lunar standstills, in this case, minor standstills.

Worship of the moon is thought to have originated in the early years of the Roman Kingdom. That so much of ancient Rome is aligned to the moon and one of its oldest buildings, the Pantheon, is aligned to the moon relative to the Hudson Bay pole may be no coincidence, particularly in light of the Roman practice of building over older structures, a practice that they could have inherited from an earlier civilization that also held a special reverence for the moon.

References

Giulio Magli (2008), โ€œOn the orientation of Roman towns in Italy,โ€ Oxford Journal of Archaeology 27 (1), 63–71.

Mary Beard, The Parthenon, rev. ed. (Harvard University Press, 2010).

Amelia Carolina Sparavigna (May 29, 2016) โ€œThe Decumani of Naples and the Minor Lunar Standstill,โ€ PHILICA, Article number 608. Available at SSRN: https://ssrn.com/abstract=2786259.

Amelia Carolina Sparavigna (July 10, 2016) โ€œAugusta Emerita and the Major Lunar Standstill of 24 BC,โ€ PHILICA Article Number 635, Available at SSRN: https://ssrn.com/abstract=2807544.

Amelia Carolina Sparavigna (July 19, 2016) โ€œ A Possible Astronomical Orientation of the Curia Julia in the Forum of Rome,โ€ PHILICA Article number 639, Available at SSRN: https://ssrn.com/abstract=2811625.

Amelia Carolina Sparavigna and Lidia Dastrรน (May 27, 2018) โ€œThe Pantheon, eye of Rome, and its glimpse of the sky,โ€ Available at HAL: https://hal.archives-ouvertes.fr/hal-01800694.

Mark Carlotto (2019a) โ€œArchaeological Dating Using a Data Fusion Approach,” SPIE Defense + Commercial Sensing Conference on Signal Processing, Sensor/Information Fusion, and Target Recognition XXVIII (11018), Baltimore MD, April 14-18, 2019.     

Mark Carlotto (2019b) โ€œNew Models to Explain the Alignments of Greek Temples.โ€ Available at SSRN: https://ssrn.com/abstract=3501950 or http://dx.doi.org/10.2139/ssrn.3501950

Mark Gaffney (2020) Deep History and the Ages of Man. Independently Published.

Mark Carlotto (2020a) โ€œAn Analysis of the Alignment of Archaeological Sites,โ€ Journal of Scientific Exploration 34(1):13. DOI: 10.31275/2020/1617

Mark Carlotto (2020b) โ€œA New Model to Explain the Alignment of Certain Ancient Sites,โ€ Journal of Scientific Exploration 34(2):209-232. DOI: 10.31275/20201619

Mark Carlotto (2022) โ€œToward a New Theory of Earth Crustal Displacement,โ€ Journal of Scientific Exploration 36(1):8-23. DOI: 10.31275/20221621


Featured image at the top of the article courtesy Jรถrg Bittner (Unna). Creative Commons. 

On the Geomagnetic Alignment of Chinese Pyramids

An analysis of the geomagnetic alignment of more than three dozen earthen pyramids in China reveals a number of interesting correlations between the date of construction and size. A strong correlation (R = 0.79) between the orientation of a pyramidal mound and the direction of the geomagnetic pole at the time of construction supports the idea that the Chinese used some form of a magnetic compass to align many if not all these structures. A moderate negative correlation (R = โ€“0.59) between the size of a mound and its date of construction reveals that older mounds tend to be larger and decrease in size over time. Comparing these findings with those from a previous study of 3rd to 5th Dynasty Egyptian pyramids suggests that it is possible the ancient Chinese, as well as the Egyptians, could have repurposed/reused older and larger structures as tombs for later day rulers and their families.

Click here to read full paper

The Chinese Pyramids

In China, numerous pyramidal mounds are thought to have been constructed as mausoleums and burial mounds containing the remains of early emperors and their families. Some are oriented in known geographical or astronomical detections, but most are not. These structures were unknown in the West before the 20th century. One of the first to gain widespread attention following World War II was the tomb of Emperor Wu of the Han Dynasty (156 โ€“ 87 BCE), which became known as the White Pyramid.

Most (but not all) of the Chinese pyramids are in the Guanzhong region between the Qinling Mountains to the south and several mountain ranges to the north.

Geomagnetic Dating

Unlike the geographic pole, which is relatively fixed over time, the geomagnetic pole moves as the earthโ€™s magnetic field changes. According to the geomagnetic alignment hypothesis, which was first proposed by Robert Fuson, dates when a site is aligned to the geomagnetic pole (i.e., when a magnetic compass aligns to the principal axis of the site) are possible dates for its construction (or modification). For sites within the range of magnetic declinations in China over the past 4000 years, we selected the geomagnetic pole that most closely lined up to the site and used it as the basis for dating the site. When an alignment could be associated with more than one date, the one closest to the dynastic date was chosen. Dynastic and geomagnetic dates of Chinese pyramid sites are plotted below:

Given the limited accuracy of the geomagnetic pole data, particularly as you go back farther in time, we find significant differences between dynastic and estimated geomagnetic dates. Differences of a century or less in later Sui and Tang dynasty tombs increase to up to five centuries in the early Han dynasty.

Magnetic declination in central China over the past 4000 years. Positive angles are east of north and negative angles are west of north.

Anomalous Alignment

The greatest difference in alignment is for the tomb of Chinaโ€™s first emperor Qin Shi Huang (Tomb of First Emperor in Lintong) located within a massive earthen pyramid approximately 360 x 360 meters (33 acres) in area. Its size is considerably larger in area than the Great Pyramid of Cholula in Mexico (273 x 295 meters) and the Pyramid of Khufu in Egypt (230 x 230 meters. Qin Shi Huang ruled China until 210 BCE. If his burial site was constructed and geomagnetically aligned at this time, it should be oriented approximately 7ยฐ west of north. As shown in the animation below, the pyramid is oriented about 1.5ยฐ east of north. This direction lies between the 1900 BCE and 1800 BCE geomagnetic poles. There is no other geomagnetic alignment at a declination of 1.5ยฐ from 1800 BCE until 200 CE, which is more than 400 years after the death of Qin Shi Huang. It is difficult to account for this discrepancy in terms of geomagnetic pole accuracy.

Geomagnetic pole alignment between 200 BCE and 1900 BCE (date in the upper left corner). The best alignment is between 1800 BCE and 1900 BCE. (Base image courtesy Google Earth.)

A Possible Explanation

If the pyramid was aligned geomagnetically one possible explanation for the discrepancy between its dynastic and geomagnetic date is that the pyramid is much older than the tomb contained within it. In other words, Qin Shi Huang could have been buried within the preexisting structure. Before Consort Ban, geomagnetic dates tend to be earlier than dynastic dates. The negative bias of the geomagnetic dates backward in time suggests the possibility that earlier pyramids could have been reused for later-day burials.

The Chinese historian Sima Qian, writing a century after Qin Shi Huangโ€˜s death, states that it took 700,000 men to construct his mausoleum, a labor force whose size has been disputed. It is interesting that in his account Sima Qian never mentions the thousands of terracotta statues buried east of the pyramid to protect the emperor in the afterlife from evil spirits. The Terracotta Warriors, which were excavated in 1974 are lined up in a direction slightly south of due east. Based on the orientation of its surrounding enclosure, their alignment would appear to be the same as the pyramid suggesting the array of Terracotta Warriors was aligned at the same time as the pyramid. It is possible that Sima Qian did not mention the statues because they were buried at the time and had been buried for more than a thousand years.

Plotting pyramid area versus date shows a low to moderate negative correlation. A negative correlation implies the size of pyramids tended to decrease over time. In other words, the oldest pyramids should be the largest. If we accept the geomagnetic dating of the pyramid containing Qin Shi Huangโ€™s mausoleum, then the oldest pyramid is the largest.  

A Similar Trend?

Based on an analysis of 3rd โ€“ 5th dynasty Egyptian pyramids it was hypothesized that certain 4th Dynasty pyramids could be much older than their accepted age leading to the possibility that they were not built but co-opted and modified by 4th Dynasty pharaohs. The same possibility is suggested for the first Chinese emperor based on the alignment and size of the pyramid within which he is entombed. Did Qin Shi Huang, like Khufu and Khafre, co-opt preexisting structures that were much larger than what was being built at the time for their own purposes? Over this period, the size of Egyptian pyramids strongly correlates with the age of construction, with later pyramids becoming smaller (and less well built). Could a similar trend have occurred in China?

The featured image at the top of the article is an artist’s conception of the northern sky in central China during a geomagnetic storm. (Source images courtesy of Google Earth and Wikimedia Commons.)

The Ruins of the Taklamakan Desert

Ruins of ancient shrines, temples, forts, and settlements in and around the Taklamakan Desert are generally thought to have been established no later than the third century BCE. Some of the structures at these sites excavated by M. Aurel Stein in the early 20th century were built over more ancient foundations and so could be considerably older based on their alignment to previous locations of the North Pole. 

Click here to read the paper

The Sand-Buried Ruins of Khotan

The Kingdom of Khotan was an ancient Iranian Saka Buddhist kingdom located on the branch of the Silk Road that ran along the southern edge of the Taklamakan Desert. The ancient capital is thought to have been founded around the third century BCE during the reign of the Indian emperor Ashoka. Steinโ€™s interest in this region can be summarized in the following section taken from his 1904 book The Sand-Buried Ruins of Khotan:

For systematic excavations, which alone could supply this evidence, the region of Khotan appeared from the first a field of particular promise. In scattered notices of Chinese records there was much to suggest that this little kingdom, situated on the important route that led from China to the Oxus Valley and hence to India as well as to the West, had played a prominent part in developing the impulses received from India and transmitting them eastwards. The close connection with ancient Indian art seemed particularly marked in whatever of small antiques, such as pottery fragments, coins and seals, native agency had supplied from Khotan. And fortunately for our research, archaeology could here rely on the help of a very effective allyโ€”the moving sand of the desert which preserves what it buries. Ever since human activity first created the oases of Khotan territory, their outskirts must have witnessed a continuous struggle with that most formidable of deserts, the Taklamakan; while local traditions, attested from an early date, told of settlements that had been abandoned before its advance.

More than mere stopping points along the Silk Road, Stein goes on to say:

The ruined sites explored by me have more than justified the hopes which led me to Khotan and into its desert. Scattered over an area which in a straight line extends for more than three hundred miles from west and east, and dating back to very different periods, these ruins throughout reveal to us a uniform and well-defined civilization. It is easy to recognise now that this bygone culture rested mainly on Indian foundations. But there has also come to light unmistakable evidence of other powerful influences, both from the West and from China, which helped to shape its growth and to invest it with an individual character and fascination of its own.

Using Stein’s original photos and narratives together with current high resolution satellite imagery we examine several of the sites he first uncovered. The locations of these and other sites discussed in this article are shown below.

Ancient sites in and around the Taklamakan Desert in Central Asia. (Google Earth)

Tashkurghan

Tashkurgan is a town on the western edge of the Taklamakan Desert. The area of interest contains the ruins of a Chinese fort that Stein describes as:

A line of massive but crumbling stone walls crowns the edges of a quadrangular plateau of conglomerate cliffs, roughly one-third of a mile in length on each of its faces. A small portion of the area thus enclosed, on the east side facing the river, is occupied by the Chinese fort. Its high and carefully plastered walls of sun-dried bricks stand undoubtedly on far more ancient foundations.

Shown below, an analysis of the area reveals a circular feature (a), perhaps the remains of a Buddhist stupa, in the ruins north of the fort area. A rectilinear structure at the center rotated west of north is in the same direction of a line that passes through (a) and another circular feature (b) to the south. A line in the same direction passes through two small features along the outer wall of the fort (c). This line is in the direction of a former pole in Hudson Bay suggesting the original foundations Stein alludes to in his narrative could have been first established tens of thousands of years ago and later co-opted by the Chinese. Rectilinear patterns of ruined structures north and west of the fort (d) lie in the direction of the summer solstice sunrise/winter solstice sunset relative to the Hudson Bay pole.

Analysis of the Tashkurgan fortress and surrounding area. Dotted white lines are in the direction of the Hudson Bay pole. Solid red lines are solstice alignments relative to the Hudson Bay pole. (Google Earth)

2.   Rawak

East of Tashkurgan in the western portion of the Taklamakan Desert is Rawak, perhaps Steinโ€™s most remarkable find:

Here an unexpected and most gratifying discovery awaited me. Our honest old guide had spoken only of  “an old house” to be seen there half-buried in the sand, but in reality the first glimpse showed a large Stupa with its enclosing quadrangle, by far the most imposing structure I had seen among the extant ruins of the Khotan region. Large dunes of coarse sand, rising over 25 feet in height, covered the quadrangle and part of the massive square base of the Stupa on the north-west and north-east faces. But towards the south the drift-sand was lower, and there great portions of the Stupa base, as well as the lines of masonry marking the quadrangular enclosure of the Stupa court, could be readily made out. 

Enigmatic figures depicted in sculptures at Rawak. (M. Aurel Stein)

What Stein found most interesting was not the stupa itself but the sculptures decorating the walls of the courtyard that had been buried in the sand for centuries if not millennia. The geometry of the site is perhaps even more remarkable. The axes of the stupa and its quadrangular enclosure are rotated too far away from the cardinal directions to be aligned to the sun (solstices) or moon (lunar standstills). However, like Tashkurgan, if we assume a different reference frame, the southwest-northeast axis turns out to be very closely aligned in the direction of major lunar standstills relative to the Hudson Bay pole placing its origin in the same epoch as Tashkurgan โ€“ at least 12,000 to 18,000 years ago.

3.   Endere

Continuing west to east, an extensive array of ruins can be found in Endere including an ancient fort and Buddhist temple. Steinโ€™s exploration of the fort raised more questions than answers:

During the days following I had almost all the buildings within the enclosing ramparts cleared of sand. These excavations furnished interesting data as to the methods of construction employed, but failed to throw much light on the original destination of the whole of this ruined settlement. The large brick building to the east of the temple, of which a portion left exposed by the sand occupies with its massive walls of sun-dried bricks three sides of a quadrangle over 100 feet square. The dimensions of its rooms suggest public use; but as, with the exception of a walled fireplace or two, they were found completely empty, there was nothing to prove the true character of the structure. Were these the quarters of a well-to-do monastic establishment which found it advisable to protect itself by walls and ramparts? Or do the latter mark a fortified frontier-post which sheltered also a Buddhist temple?

Where Stein felt that he โ€œhad reached the border-line beyond which Indian influences yielded to Chinese,โ€ other structures at Endere seem to straddle an even more ancient border-line between history and prehistory.

Surviving features of the fort (top right) are aligned in the direction of the geomagnetic pole circa 200 BCE, which corresponds to the period when the area was under the control of the Han Dynasty. A stupa northwest of the fort (bottom right) appears to be aligned in a different direction that corresponds to the direction of major lunar standstills relative to the Hudson Bay pole. Nearby ruins (left) are cardinally aligned (N-S-E-W) relative to the same pole suggesting these structures could be considerably older than the fort.

Ruins at Miran including a stupa (top) and several temples that appear to be cardinally aligned relative to the Hudson Bay pole. (Apple Maps)

4.   Miran

The pattern of structures aligned to the Hudson Bay pole extends to Miran, at the eastern end of the Taklamakan Desert. At Miran, Stein first encountered four ancient structures including two stupas – one โ€œwell-preservedโ€ and the other โ€œmuch decayed.โ€ Two remaining ruins were โ€œsquare structures solidly built in sun-dried bricks of unusual hardness.โ€ Visible structures appear to be rotated slightly west of north in the direction of the Hudson Bay pole.

About a kilometer east of these ruins, lies an ancient Tibetan fort that Stein found to be less than remarkable, stating โ€œthe crumbling walls and bastions were massive enough in dimensions, but their inferior construction seemed to suggest a relatively late date.โ€œ Less than 2 km northeast of the fort he found a ruined temple in which he uncovered an enormous Buddha head. Based on his findings Stein concluded that โ€œthe temple dated from a period far more ancient than that ascertained for the Tibetan fort. A number of observations made it appear a priori probable that a site of considerable antiquity had been reoccupied here, as in the case of Endere.โ€

Locations and alignments of sites to the current Arctic (Ar), and previous Hudson Bay (HB), Norwegian Sea (NS), Greenland (Gr), and Bering Sea (BS) poles. Alignment key: equinox (E), solstice (S), major (M) and minor (m) lunar standstills, and geomagnetic north (X).

5.   Discussion

The above table summarizes the alignments of these and other ancient sites in the Taklamakan Desert and surrounding regions. Most of the sites appear to reference previous poles, especially the Hudson Bay pole. This is particularly interesting as it extends a pattern discussed in previous articles that appears to stretch from the Arabian Peninsula, through India, into and now across Central Asia. That the alignments of so many structures appear to reference the Hudson Bay pole supports the hypothesis that these sites were first established by an earlier pre-cursor civilization that existed in this part of the world no less than 12,000 to 18,000 years ago (Carlotto 2022). Although this hypothesis explains the alignment of these sites in a simple way it does not account for the alignment of all of the sites in the region or the possibility that some of the sites might have been aligned in other ways such as to the geomagnetic pole, a possibility that will be considered in a forthcoming article.

Feature image at the top of the article of the Rawak stupa is courtesy of The International Dunhuang Project.