


The first three chapters in An Inconvenient Theory highlight key problems with current theories. Problems or anomalies are what drive the scientific process of coming up with new hypotheses, experiments, and ultimately new theories. Chapters 4-6 trace the development of a revised and expanded version of Hapgood’s theory.
Other Frames of Reference
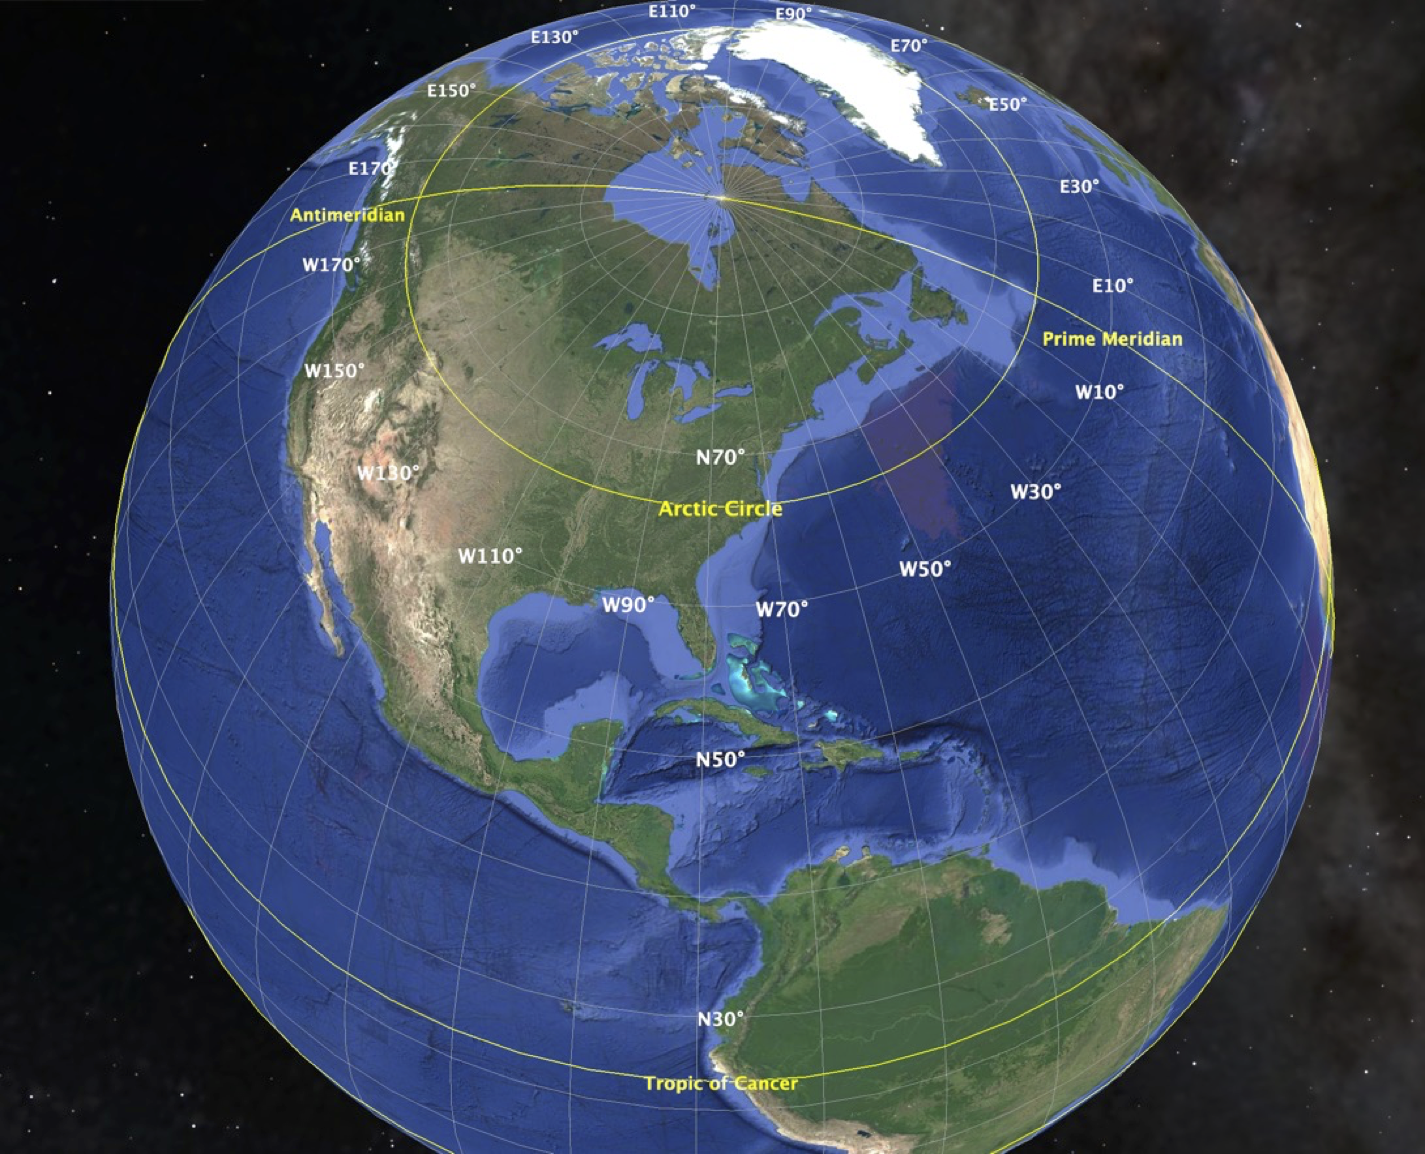
Chapter 4 examines the hypothesis that many ancient structures around the world, currently misaligned with modern cardinal or astronomical directions, may have been originally aligned to different geographic poles due to shifts in Earth’s crust—a theory proposed by Charles Hapgood. Using great circle algorithms and site orientation data, analysis of over 900 ancient sites identifies four historical pole locations—Hudson Bay, Norwegian Sea, Greenland, and the Bering Sea—that explain the orientations of hundreds of previously unexplained alignments. These alignments suggest a global pattern of intentional astronomical positioning consistent with solar and lunar cycles, and statistical analysis indicates the improbability of such correlations occurring by chance. This framework challenges conventional archaeology by proposing a testable, mathematical approach that supports the theory of pole shifts and has significant implications for understanding ancient civilizations and past climate changes.
How to Melt Ice in a Cold World
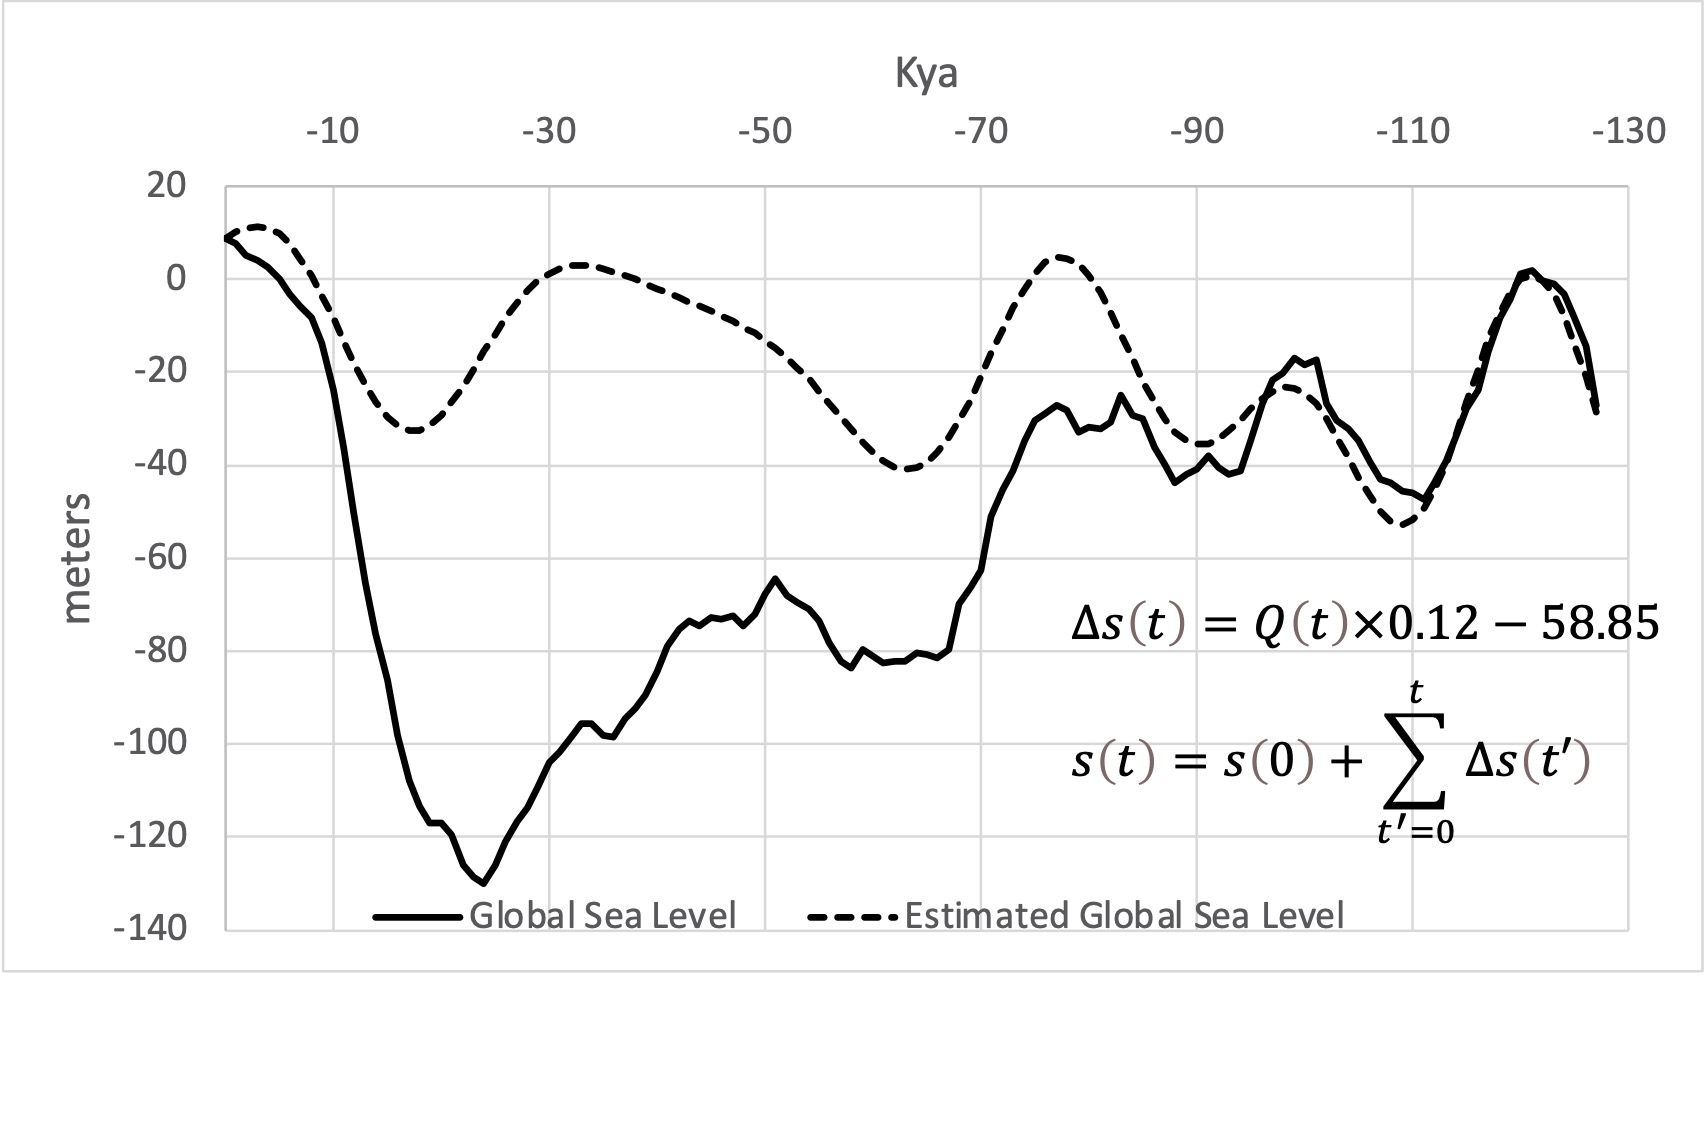
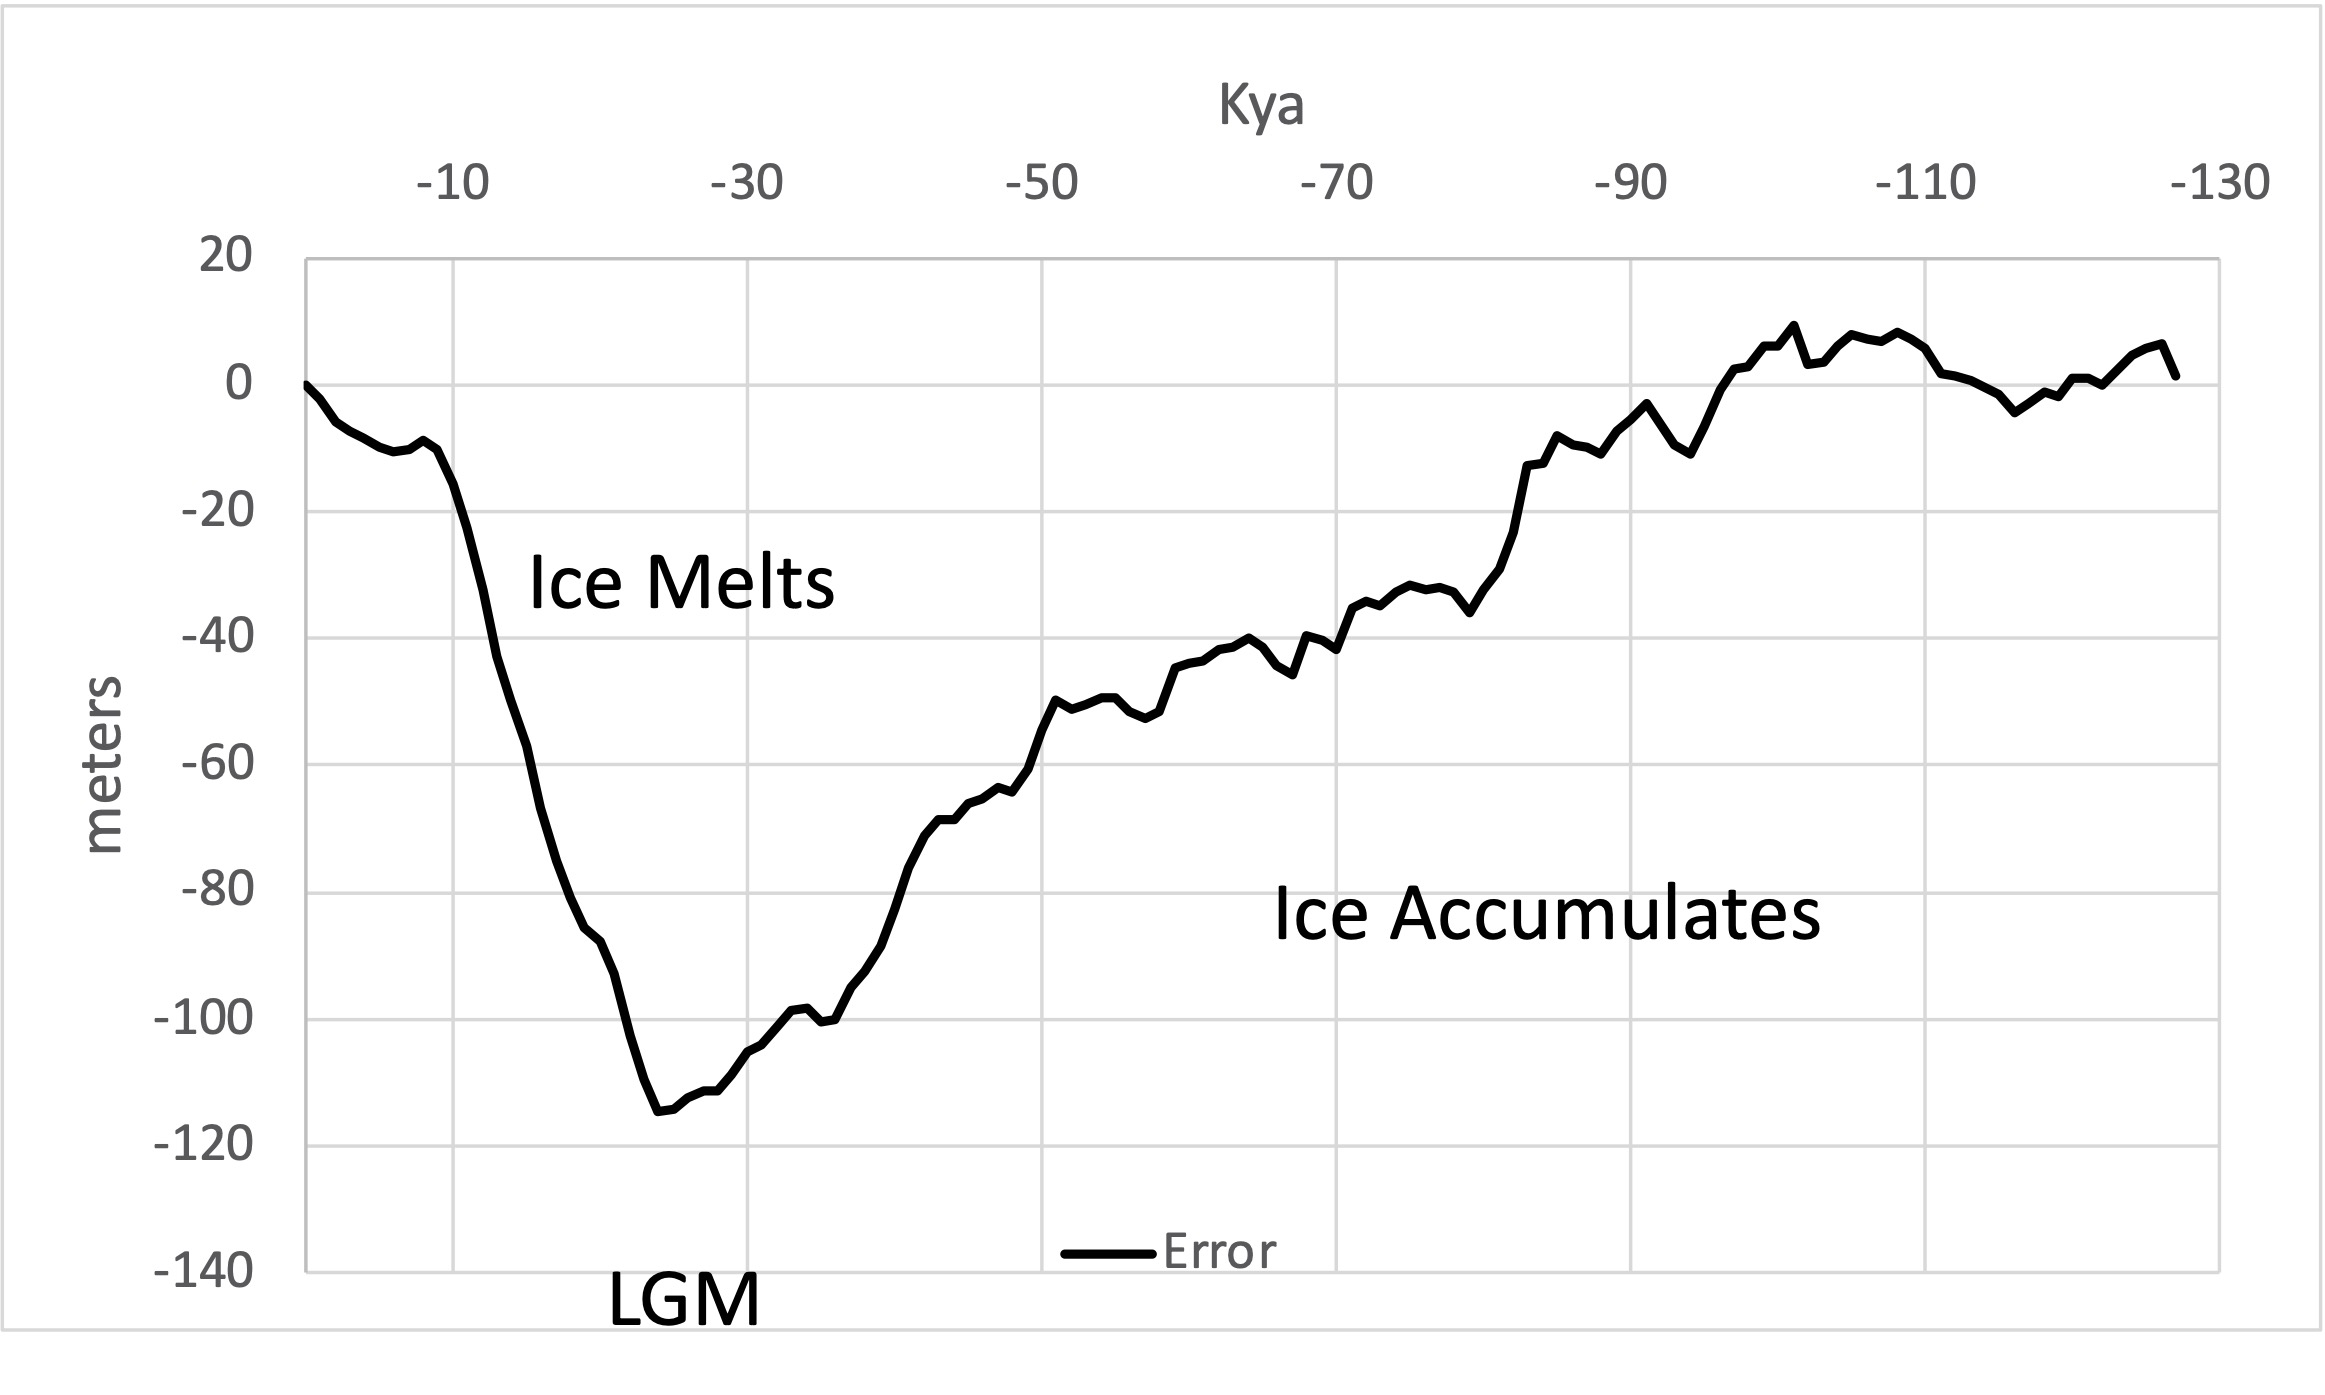
Chapter 5 explores the inadequacy of traditional climate models in explaining how massive polar ice sheets melted during the coldest periods of Earth’s last glacial cycle, and proposes an alternative mechanism involving crustal displacements. Drawing parallels to Copernicus’s simplification of planetary motion, the chapter critiques existing theories like Milankovich cycles and CO₂ feedback for failing to fully account for sea level changes. Instead, it advances the idea, inspired by Charles Hapgood, that geographic pole shifts repositioned ice sheets to lower latitudes, where increased solar insolation caused rapid melting. This hypothesis is supported by correlations between polar land area and sea level, as well as the location of the thickest ice in Greenland and Antarctica aligning with regions that remained in polar zones over successive shifts. The chapter also examines ancient maps like the Orontius Fineaus map, suggesting they may depict an ice-free Antarctica based on observations made during past pole configurations, reinforcing the plausibility of large-scale crustal movement as a driver of climate transitions.
Ice Ages Revisited
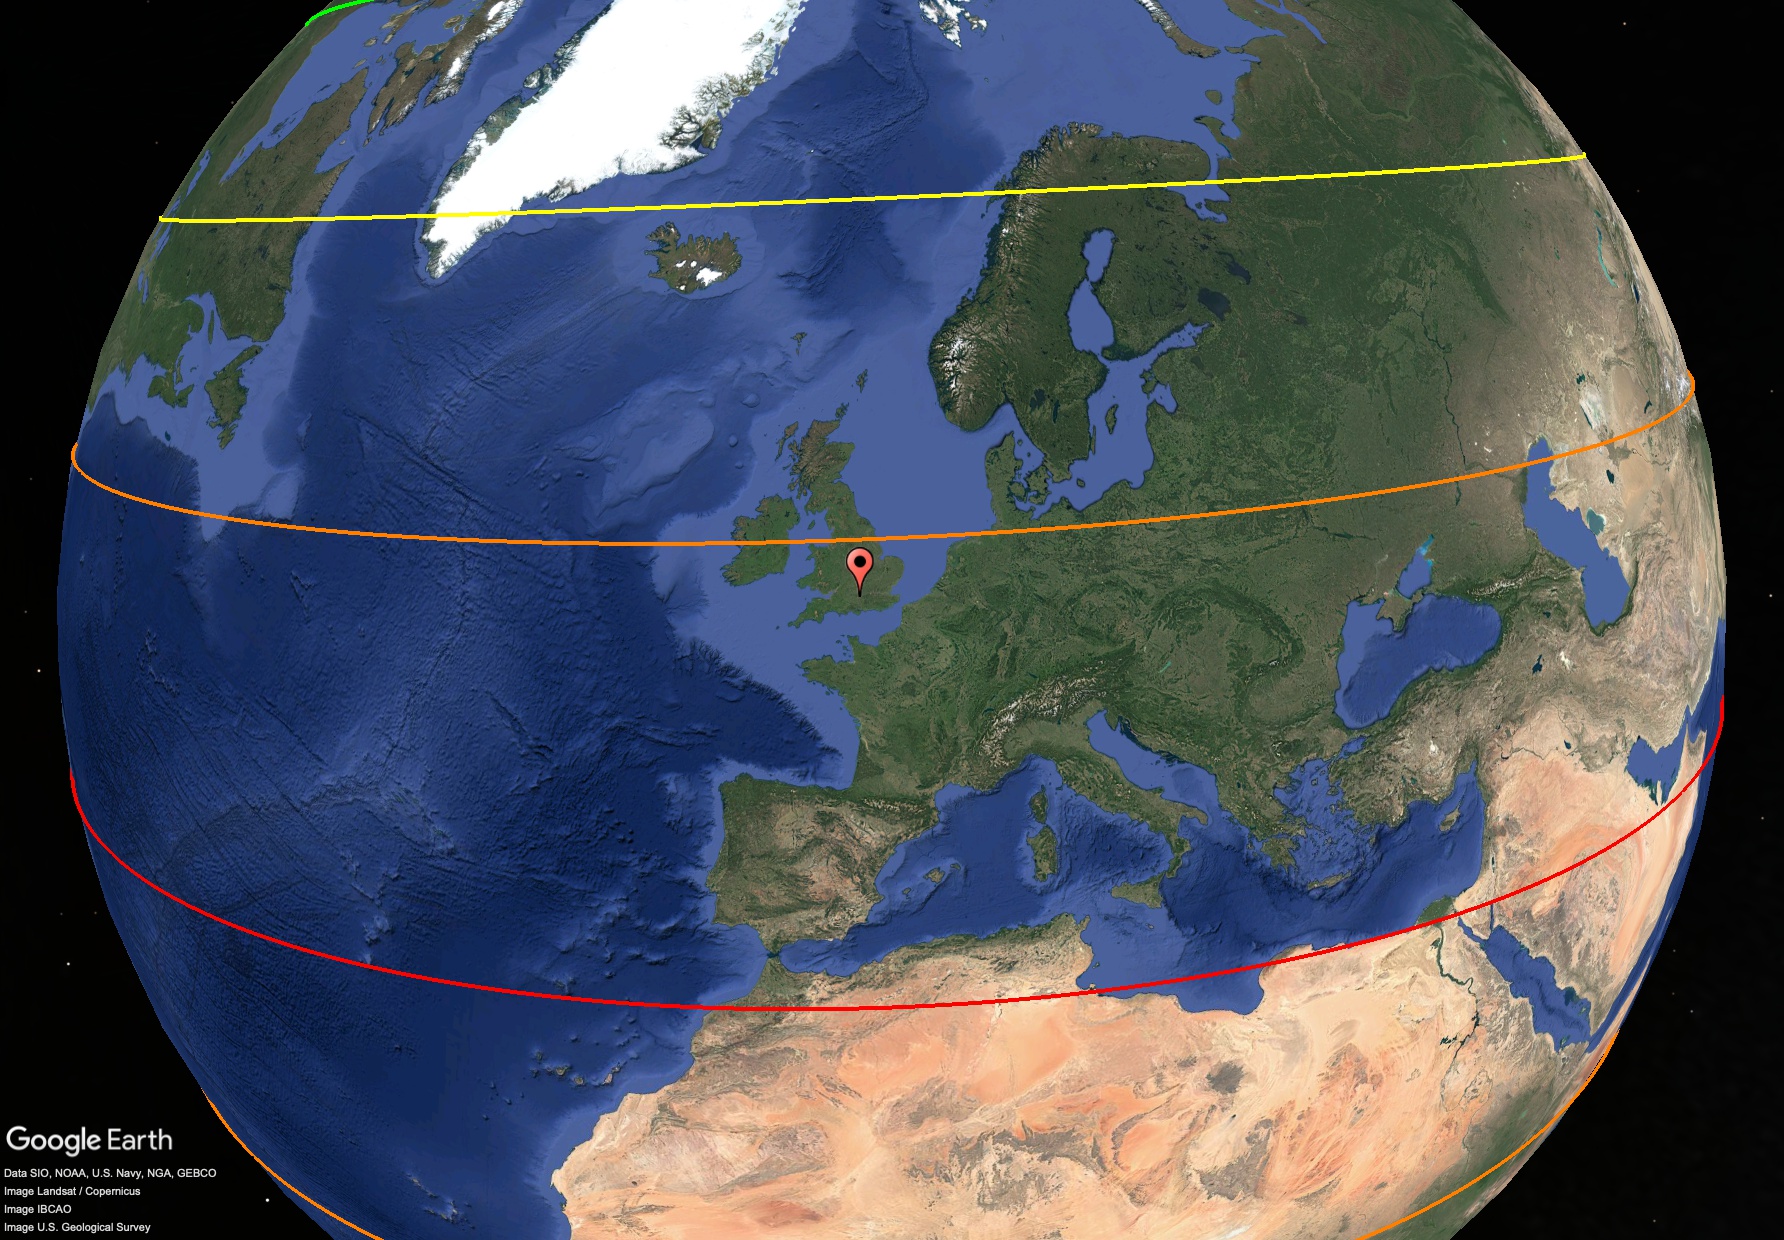
Chapter 6 considers an alternative theory to Milankovitch cycles by proposing that dramatic shifts in Earth’s climate during the Ice Ages were caused by displacements of the lithosphere and corresponding pole shifts, not fluctuations in solar radiation. Drawing on Karl Pauly’s 1952 analysis and Charles Hapgood’s theory of Earth crustal displacement, the chapter presents evidence that shifting pole positions led to changes in geographic climate zones, explaining alternating glacial and interglacial periods. Fossil and archaeological records from Britain, Mexico, the San Augustin Plains, the Arabian Peninsula, and other places are used to correlate shifts in fauna, flora, and human activity with these hypothesized pole movements. Key examples include the presence of tropical animals in Ice Age Britain, changes in mammoth habitat linked to pole shifts, and archaeological water symbolism in Teotihuacan aligning with a wetter, temperate climate during earlier pole locations. The chapter questions conventional climate models, suggesting that geographic pole shifts better account for regional climate anomalies observed in the paleoclimatic record.
As the archaeological implications of crustal displacement theory were covered in Before Atlantis and Beyond Atlantis, the last article in this series delves into the search for an underlying mechanism.
Feature image at the top of the article: Meridians to sites aligned to the current pole (white) and four previous locations of the North Pole in Hudson Bay (magenta), the Norwegian Sea (yellow), Greenland (green), and the Bering Sea (red). (Google Earth)

